
|
Sunday, April 29, 2007
Improved assessment of national IQ
Send this entry to: Del.icio.us
Spurl
Ma.gnolia
Digg
Newsvine
Reddit
Heiner Rindermann, Relevance of education and intelligence at the national level for the economic welfare of people, Intelligence, In Press
Cognitive abilities are important for the economic and non-economic success of individuals and societies. For international analyses, the collection of IQ-measures from Lynn and Vanhanen was supplemented and meliorated by data from international student assessment studies (IEA-Reading, TIMSS, PISA, PIRLS). The cognitive level of a nation is highly correlated with its educational level (r = .78, N = 173). In international comparisons, it also shows a high correlation with gross national product (GNP, r = .63, N = 185). However, in cross-sectional studies, the causal relationship between intelligence and national wealth is difficult to determine. In longitudinal analyses with various samples of nations, education and cognitive abilities appear to be more important as developmental factors for GNP than economic freedom. Education and intelligence are also more relevant to economic welfare than vice versa, but at the national level the influence of economic wealth on cognitive development is still substantial. Combining IQ scores with a variety of other assessments of average cognitive ability at the national level has a lot to recommend it, and I'm glad others have caught on. The conclusions are quite interesting: The results reported here show that during the last third of the 20th century, education and cognitive abilities were more important for economic wealth than economic wealth was for education and cognitive abilities. This result is stable across the different national samples of education and ability and remains after adding additional factors like economic freedom. Intelligence is even more important for wealth than economic freedom (see also Weede, 2006)! Whereas the importance of intelligence for many personal life outcomes has been recognized for some time (Gottfredson, 2003 and Herrnstein and Murray, 1994), we should realize that intelligence is also an important determinant for the economic and social development of nations (for example the functioning of institutions in the systems of law, economics and politics). The present study shows that a high level of cognitive development can be an antecedent and likely cause for economic growth, but other macro-social outcomes (e.g., democracy, rule of law, national power or health) are likely to be influenced by education and intelligence as well (Rindermann, submitted for publication and Rindermann, submitted for publication). Certainly the positive influence of young people's schooling and intelligence on the level of economic freedom 30 years later (Fig. 4 and Fig. 5) deserves further investigation. Future theoretical and empirical research has to analyze the causal mechanism underlying the effects of ability on development of societies in a more detailed manner. For example, there is a positive relationship with low government spending ratio (r = .47 and rp = .24). Abilities seem to enable a more liberal economic constitution and thriftiness of state interventions. Conversely, a population with low education and intelligence seems to necessitate more state intervention, which tends to widen the influence of powerful special-interest groups. So higher IQ populations tend to be more libertarian? A re-colored version of Figure 1 -- a world map -- is below the fold. 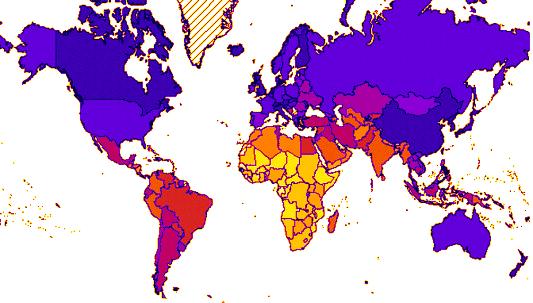 Labels: general intelligence, national IQ Sunday, April 22, 2007
Validity of national skin color-IQ
Send this entry to: Del.icio.us
Spurl
Ma.gnolia
Digg
Newsvine
Reddit
We previously reported that a measure of school achievement built from national test scores has a nearly perfect correlation with national IQ (at least in the range of scores tested). Subsequently, Lynn et al. (in press) published a very similar analysis:
This paper examines the relationship of the national IQs reported by Lynn & Vanhanen (2002, 2006) to national achievement in mathematics and science among 8th graders in 67 countries. The correlation between the two is 0.92 and is interpreted as establishing the validity of the national IQs. The correlation is so high that national IQs and educational achievement appear to be measures of the same construct. National differences in educational achievement are greater than differences in IQ, suggesting an amplifier effect such that national differences in IQs amplify differences in educational achievement. Controlling for national differences in IQ, slight inverse relationships of educational achievement are observed with political freedom, subjective well-being, income inequality, and GDP. However, public expenditure on education (as % of GDP) was not a significant predictor of differences in educational achievement. The IQ's Corner blog has an interesting note about forthcoming commentary. On a related note, recall that Templer & Arikawa (2006) reported a near perfect environmental correlation between national skin color and national IQ for old-world countries. An unfortunately confused commentary by Hunt & Sternberg accompanied the publication. They wrote: "We argue that the report by Templer and Arikawa contains misleading conclusions and is based upon faulty collection and analysis of data. The report fails to hold up for quality of data, statistical analysis, and the logic of science." The criticisms by Hunt & Sternberg are based largely on a misreading of Templer & Arikawa's methods, particularly the method for deriving national skin color values. A paper published in 2000 by Jablonski & Chaplin ("The evolution of human skin coloration") can more directly address these criticisms. Jablonski & Chaplin published a table of skin color reflectance values from many old world populations (Table 6, also see the appendix). I very crudely averaged values from the same country to make a new measure of national skin color. This measure of national skin color correlates with the skin color index of Templer & Arikawa at r=-.91 (the negative is not important here). The reflectance measure of skin color correlates with national IQ at r=.87. The school achievement measure of Lynn et al. correlates r=-.79 with the skin color index of Templer & Arikawa and r=.75 with the skin color reflectance values crudely averaged from Jablonski & Chaplin. Thus, the skin color values derived by Templer & Arikawa are well validated by an external data source and the national IQ-skin color relationship is found to be robust across two measures of national IQ and two measures of national skin color. Note that there are substantially more missing values in the school achievement and skin reflectance data sets (no imputation of missing values) with missing values skewed towards lower values of national IQ/school achievement and darker skin colors. Also note that the blind averaging use on the skin reflectance data most likely attenuates the correlations. Templer & Arikawa had two abstracts at the 2006 ISIR conference, which provide additional support for the validity of the measures and their relationships: source Correlations of Skin Color and Continent with IQ Donald I. Templer & Hiroko Arikawa The present study determined (1) the correlations between skin color and IQ across the countries of three different continents; and (2) the correlations of both skin color and continent in the three pair combinations with the three continents. The product-moment correlations between IQ and skin color were -.86 across the 48 African countries, -.55 across the 48 Asian countries, and -.63 across the European countries. When the 96 countries of Africa and Asia were combined skin color correlated -.86 and continent correlated .75 with IQ. The respective correlations were -.97 and .89 across the 81 countries of Asia and Europe, and -.71 and .54 across the 81 countries of Europe and Asia. In multiple regression continent yielded minimal increment to skin color in predicting IQ. In an earlier study (Templer & Arikawa, 2006a) skin color correlated more highly with IQ than racial category, but racial category yielded greater increments in multiple regression than did continent in the present study. The present findings, combined with previous research relating skin color and IQ (Templer & Arikawa, 2006a; 2006b), indicate that skin color is a robust correlate of IQ in an international perspective. Empirical Support for Rushton's K Differential Theory Donald I. Templer & Hiroko Arikawa The purpose of the present study was to empirically substantiate Rushton's Differential K Theory that purports that groups of persons with K (in contrast to r) characteristics have a life history and reproductive strategy that includes higher intelligence, less reproduction, less sexual activity, better care of offspring, lower birth rates, greater life expectancy, better impulse control, and greater social organization. The present research intercorrelated national mean IQ, infant mortality, HIV/AIDS rates, birth rates, prevalence rates, and life expectancy in 129 countries in Africa, Asia and Europe. All of the correlations were substantial and in the expected direction. Also supportive of Rushton's theory is that there was only one factor which accounted for 75% of the variance and was labeled "K-r continuum." All five variables were correlated with an economic variable (per capita income) and a biological variable (skin color, which correlated highly with intelligence in previous research). Skin color correlated more highly with all five variables than per capita income so as to support the contention of Rushton that this continuum is biologically based. Factor analysis with all seven variables yielded one factor that accounted for 73% of the variance. Jason Malloy adds: Templer & Arikawa's research follows Lynn and Rushton in arguing that cold temperatures were a significant force in the evolution of human race differences in intelligence. I have stated some problems I find with this hypothesis here, although it is also largely consistent with the geographic distribution of global populations by IQ. A recent analysis by blogger Audacious Epigone adds yet another revealing data point to this association. Latitude (and hence colder climate) is associated with IQ not only cross-nationally (.67) but within the US as well. AE found a correlation of .70 between his measure of state IQ and the latitude of the most populous city in each of the 50 states. Furthermore intelligence is associated with latitude equally for both US whites and blacks (.52 and .51). It's not immediately apparent if and how this association is genetic or environmental. Either way it seems fair to seriously consider that global warming will provide yet another detrimental negative pressure on the intelligence of human populations in the coming decades. Labels: general intelligence, national IQ, skin color Wednesday, April 18, 2007
Follow up to IQ, height & Crooked Timber: John Quiggin @ Crooked Timber wrote "I'd be interested to read a GNXP view of the main developments in recent decades, taking account of the Flynn effect." I don't know that a "GNXP view" exists on this subject aside from what appears to be the scholarly consensus where such a consensus exists. However, as a down payment on a response, I've gathered several sources which should help to inform the interested reader about modern views on the genetics of IQ and the Flynn effect.
For a general background on IQ and intelligence, two publications in response to The Bell Curve: * "Intelligence: Knowns and Unknowns", the APA task force report (1995) * "Mainstream Science on Intelligence", signed by 52 professors (1994) For a quick technical review of the genetics of g, see the review by Plomin (2003), which I pasted below the fold. (Lest you think there's nothing new, note the distribution of publication dates among the references.) For a bleeding-edge discussion of the Flynn effect, I can recommend two sources. A draft of a new book by Flynn and a book review by Lynn (pasted below the fold). Regulars may want to begin by reading below the fold. Guest Editorial Genetics, genes, genomics and g Robert Plomin1 1Social, Genetic and Developmental Psychiatry Research Centre, Institute of Psychiatry, London SE5 8AF, UK. Email: r.plomin@iop.kcl.ac.uk Abstract Molecular Psychiatry (2003) 8, 1-5. doi:10.1038/sj.mp.4001249 This issue includes three papers1,2,3 on a topic of increasing interest to molecular psychiatrists: the genetics of intelligence. There was also a related article in a previous issue of Molecular Psychiatry.4 These four papers represent the range of research on genetics (quantitative genetic twin studies), genes (molecular genetic attempts to identify genes) and genomics (understanding the function of genes). The goal of this editorial is to put these papers in perspective. Intelligence is the most complex┬Šand most controversial┬Šof all complex traits. So why study the genetics of such a complex and controversial trait? The word 'intelligence' has so many connotations that the symbol 'g' was proposed nearly a century ago to denote the operational definition of intelligence as a 'general cognitive ability' representing the substantial covariance among diverse tests of cognitive abilities such as abstract reasoning, spatial, verbal and memory abilities.5 In a meta-analysis of 322 studies, the average correlation among such diverse tests is about 0.306 and a general factor (first unrotated principal component) typically accounts for about 40% of the tests' total variance.7 As discussed below, multivariate genetic analysis shows that the genetic overlap among cognitive tests is twice as great as the phenotypic overlap, suggesting that g is where the genetic action is. Although g is not the whole story, trying to tell the story of cognitive abilities without g loses the plot entirely. This strong genetic g factor running through diverse cognitive processes has important implications for genetic research in neuroscience since g is molar and flies in the face of the widespread assumption in cognitive neuroscience that the brain functions in a modular manner.8 In addition, the long-term stability of g after childhood is greater than for any other behavioral trait,9 it predicts important social outcomes such as educational and occupational levels far better than any other trait,10 and it is a key factor in cognitive aging.11 g is specifically relevant to molecular psychiatry because, as discussed below, mild mental retardation appears to be the low extreme of the normal distribution of g. Moreover, at least 200 single-gene disorders include mental retardation among their symptoms.12 Quantitative genetics Quantitative genetic research┬Štwin and adoption studies┬Šestimates the net effect of genetic variation on phenotypic variation regardless of the number of genes involved or the complexity of their interactions. Such research charts the course for molecular genetic studies by identifying the most heritable components and constellations of phenotypes. The first twin and adoption studies were conducted in the 1920s on g and suggested substantial genetic influence.13,14,15 Since then, with the exception of personality assessed by self-report questionnaires, more research has addressed the genetics of g than any other human characteristic. Dozens of studies including more than 10 000 twin pairs and hundreds of adoptive families as well as more than 8000 parent-offspring pairs and 25 000 sibling pairs consistently indicate substantial heritability.16 Heritability estimates vary from 40 to 80% but meta-analyses based on the entire body of data yield estimates of about 50%,17,18 with increasing heritability from infancy (20%) to childhood (40%) to adulthood (60%).19 Most of the genetic variance for g is additive, which facilitates attempts to identify genes responsible for its heritability.20 Since the substantial heritability of g is better documented than for any other biological or behavioral dimension or disorder, quantitative genetic research has moved beyond heritability to ask more refined questions about development, about the interface between nature and nurture, and about multivariate issues.21 A finding of great significance for molecular psychiatry and neuroscience has emerged from multivariate genetic research that analyzes the covariance among cognitive tests rather than the variance of each test considered separately.20 As noted earlier, the average phenotypic correlation among diverse cognitive tests is about 0.30. In contrast, multivariate genetic research indicates that genetic correlations among such tests are at least 0.80 on average.22 (A genetic correlation indexes the extent to which genetic effects on one trait correlate with genetic effects on another trait independent of the heritability of the two traits.) The extremely high genetic correlation among diverse cognitive tests means that genes associated with one cognitive ability are highly likely to be associated with all other cognitive abilities. This evidence for 'genetic g' means that g is an excellent target for molecular genetic research in the cognitive domain. It should be noted that genetic g does not necessarily imply that there is a single fundamental brain process that permeates all other brain processing, such as a 'speedy brain',8 neural plasticity,23 or the quality and quantity of neurons.24 It has been proposed that g exists in the brain in the sense that diverse brain processes are genetically correlated.25 For example, gray and white matter densities in diverse brain regions are highly heritable, substantially intercorrelated across brain regions, and correlated genetically with g.26,27 One of the papers in this issue provides a good example and description of multivariate genetic analysis.3 Rather than analyzing the covariance between cognitive tests, the study investigated the genetic and environmental origins of the covariance between normal variation in behavior problems and g in children. For 376 pairs of twins from 6 to 17 years of age, nearly all of the modest phenotypic correlation (-0.19) between behavior problems and g could be accounted for by genetic covariation. Similar results were obtained in another study of 4000 pairs of young twins assessed at 2, 3 and 4 years; the large sample made it possible to show that phenotypic and genetic links may be stronger at the extremes of behavior problems and cognitive problems.28 Another multivariate genetic finding of great importance concerns genetic links between common disorders and dimensions of normal variation. This research suggests that common disorders (but not rare disorders) are merely the quantitative extreme of the same genetic and environmental influences that operate throughout the normal distribution. For example, a sibling study of mental retardation found that the average IQ of siblings of severely retarded probands was normal, 103, which implies that severe mental retardation shows no familial links with normal variation in g.29 This finding makes sense in relation to the rare single-gene12 and chromosomal causes30 of severe retardation that are not usually inherited because they occur spontaneously. In contrast, siblings of mildly retarded probands showed a substantially lower mean IQ score of 85.29 In other words, mild mental retardation but not severe retardation shows familial (presumably genetic) links with normal g variation. The first twin study of mild mental retardation confirms that mild mental retardation is strongly linked genetically to normal variation in g.31 This evidence for strong genetic links between disorders and dimensions┬Ševidence that is typical of common disorders such as hyperactivity, depression and alcoholism┬Šprovides support for the quantitative trait locus approach to molecular genetics, discussed later. Identifying genes There is a lot of life left in the old workhorse of quantitative genetics, especially in investigating developmental, multivariate and environmental issues that go beyond merely estimating heritability. However, the most exciting direction for research on intelligence and cognition is to move beyond genetics to genes, that is, to identify some of the genes responsible for the substantial heritability of g and other cognitive abilities and disabilities. In contrast to the slow progress in identifying genes for schizophrenia and manic-depression, greater progress has been made in the cognitive domain, most notably the well-documented association between apolipoprotein E gene and dementia32 and a solid 6p21 linkage with reading disability that is beginning to be narrowed down in association studies.33 The quantitative trait locus (QTL) perspective has come to dominate molecular genetic research on complex quantitative traits such as g as well as common disorders such as dementia and reading disability. The QTL perspective is the molecular genetic extension of quantitative genetics whereby multiple genes are assumed to be responsible for heritability, implying that genetic variation is distributed quantitatively.34 For this reason, a QTL perspective on g naturally leads to molecular genetic research on normal variation, as is also the case for personality research.35 Two papers on molecular genetics in this issue are distinctive in that they focus on normal variation in g using large unselected samples.1,4 They report positive associations between normal variation in g and two candidate genes: Cathepsin D (CTSD; 4) and cholinergic muscarinic 2 receptor (CHRM2; 1). The effect sizes are small (heritabilities of 3 and 1%, respectively) as expected for QTLs, but are easily detected as significant with the large sample sizes of these studies (767 and 828, respectively). Research on complex traits should be aiming to break the 1% QTL barrier, that is, 80% power to detect QTLs when they account for as little as 1% of the total variance (1% heritability), which requires an unselected sample of about 800 individuals when a single marker is studied (P = 0.05, two-tailed; 36). The CTSD paper4 is especially interesting in relation to the extensive molecular genetic research on dementia, which will be the source of much more molecular genetic research on g. Beginning with individuals at least 50 years old, g was assessed during a 15-year period in order to investigate the cognitive decline indicative of dementia. As in other studies, initial g scores are correlated negatively with decline across the 15 years, supporting the brain reserve capacity theory of dementia, as explained in the paper. However, CTSD is not associated with cognitive decline, which confirms the results of several other studies that found no association between CTSD and dementia. The exciting finding is that CTSD is associated with g at the first test session. Longitudinal quantitative genetic research on g indicates that age-to-age stability is largely mediated genetically whereas change is largely environmental in origin.21 This suggests that the heritability of dementia defined as decline might be modest in contrast to the heritability of g. We do not yet know how heritable dementia is because only a few small twin studies have been reported and their results are mixed.37 What is needed is a multivariate genetic analysis of g and dementia in order to investigate the extent of their genetic overlap. Other reports are beginning to emerge of candidate gene associations with g. Most notably, a functional polymorphism (VAL158MET) in the enzyme catechol O-methyltransferase (COMT) has been reported to be associated with g-related cognitive functioning in two studies.38,39 An association with g has also been reported for a gene involved in controlling homocystein/folate metabolism.40 Because research on dementia will be the immediate source of more molecular genetic research on g as in the CTSD study in this issue,4 it is worth noting that the apolipoprotein gene, which shows a strong association with dementia, shows no association with g in childhood41,42 or in adults.43 Despite the power of the two studies in this issue to detect QTL associations, replication will be crucial because the track record for replicating candidate gene associations is not good.44 This is of particular concern with studies using unselected samples because it is tempting to study many measures as well as many candidate genes thus increasing vulnerability to false positives. As a chastening confession to underline the need for replication, both papers cite our report of an association between IGF2R and g in two samples,45 but our new independent sample as large as the previous two samples combined has not replicated the association.46 Other molecular genetic issues relevant to these CTSD and CHRM2 reports are generic issues involved in any attempt to find QTLs for complex traits whether assessed as disorders or dimensions. One such issue is the use of functional polymorphisms. In the CTSD study,4 the candidate gene polymorphism is functional (C>T, Ala>Val); in the CHRM2 study,1 the single nucleotide polymorphism (SNP) is in the 3' untranslated region of the gene. The use of functional polymorphisms involves direct association that greatly increases power because it tests the hypothesis that the polymorphism is the QTL rather than relying on the marker being in linkage disequilibrium with the QTL associated with the trait (indirect association). Another advantage of using functional polymorphisms is that when associations are found, the usual house-to-house search for the culprit gene is circumvented, although it is always difficult to identify beyond reasonable doubt the QTL suspect from a line-up of genes in the neighborhood. Another generic issue is that more systematic approaches to candidate genes are needed because any of the tens of thousands of genes expressed in the brain could be proposed as candidate genes for g.47 One early association study of g examined 100 candidate genes (not including CTSD or CHRM2) but found no more replicated associations than expected by chance, although the design only provided power to detect QTLs of about 2% heritability.48 A more systematic strategy is to investigate all polymorphisms in particular gene systems.49 Another strategy is to conduct genome-wide scans for association analogous to genome scans for linkage except that many thousands of markers are needed in the case of association. The first genome-wide search for association with g has been reported using 1842 simple sequence repeat (SSR) markers using DNA pooling and groups selected for high g and controls.50 Despite a highly conservative replication procedure designed to avoid false positives, two SSRs replicated cleanly in two independent case-control samples but neither SSR association was replicated in a transmission disequilibrium test using parent-offspring trios. Genomic control analyses showed that the failure to replicate using the parent-offspring trios was not due to population stratification. Since SSR markers are unlikely to be functional, they rely on indirect association for which power falls off quickly as a function of the linkage disequilibrium distance between the marker and the QTL.51,52 Using indirect association, tens or hundreds of thousands of markers are needed for genome scans in order to exclude QTLs of 1% heritability, although haplotype maps can reduce the required number of markers.53,54 Ultimately what is needed for genome-wide association scans is to genotype every functional polymorphism in the genome. As a step in this direction, we are currently using DNA pooling to conduct a genome-wide g scan of all brain-expressed nonsynonymous SNPs in coding regions that are currently available in public databases with allele frequencies greater than 10% in Caucasian samples.55 Polymorphisms in promoters and other gene regulatory coding regions seem even better candidates for QTLs but they are much more difficult to identify and to demonstrate their functionality. Moreover, coding DNA does not have a monopoly on QTLs┬Šnoncoding RNA is likely to be a source of QTLs too,56 although determining functionality of polymorphisms in noncoding RNA will be even more difficult. It remains to be seen whether increasing power using large samples and direct association will yield replicable QTLs. DNA pooling will be useful in this context because it costs no more to genotype 1000 individuals than 100 individuals.57 Pessimists can reasonably worry about the gloomy prospect that the culprit genes will never be caught because the heritability of g might be caused by many genes with miniscule heritabilities. Some might hope that such research is never successful because of the ethical issues that would be raised if genes for g were found.21 Interesting discussions of these issues are available specifically in relation to genes and g58 and more generally in relation to behavioral genetic research.59 Behavioral genomics Quantitative genetics assesses the net effect of genes on behavior without knowing anything about which genes are involved. Molecular genetics identifies genes associated with behavior without knowing anything about the mechanisms responsible for the association. As we approach the postgenomic era in which the complete human genome sequence and all functional variations in the genome sequence are identified, the future of behavioral genetics is functional genomics, that is, understanding how genes affect behavior.60 Functional genomics usually refers to the bottom-up agenda of molecular biology such as gene expression profiling and proteomics. However, there are higher levels of analysis for understanding how genes function which need not wait until the bottom-up approach reaches them. At the other end of the continuum is the top-down approach that investigates the function of genes in relation to behavior of the whole organism. For example, the issues about multivariate relationships of heterogeneity and comorbidity, developmental change and continuity, and the interface between genes and environment can be addressed with much greater precision once genes are identified. The term behavioral genomics has been proposed to emphasize the value of this top-down level of analysis.61 Rodent models will be valuable for functional genomic research because of their ability to manipulate both genes and environment and the power they offer for investigating brain processes such as single cell recordings, micro-stimulation, targeted gene mutations, antisense DNA that disrupts gene transcription, and DNA expression. The value of rodent models rests with understanding genetically driven brain processes, not with phenotypic validity. For example, mouse models have made the greatest progress in understanding the psychopharmacogenetics of alcohol-related processes even though mice do not become drunk of their own volition.62 In this sense, although it sounds absurd, mouse models of reading disability will be valuable for understanding the brain processes underlying the genetics of reading disability. The ultimate test is whether the same genes affect the same brain processes in mouse and man. In terms of rodent models of g, clearly there are major differences in brain and mind between the human species and other animals, most notably in the use of language and the highly developed prefrontal cortex in the human species. However, g in man does not depend on the use of language┬Ša strong g factor emerges from a battery of completely nonverbal tests.7 Moreover, low-level tasks┬Šfor example, information-processing tasks assessed by reaction time┬Šcontribute to g.63 Indeed, g can be used as a criterion to identify animal models of individual differences in cognitive processes. If g represents the way in which genetically driven components of the brain work together to solve problems, it would not be unreasonable to hypothesize that g exists in all animals.64 Although much less well documented than g in humans, increasing evidence exists for a g factor in mice across diverse tasks of learning, memory and problem solving.65 A large-scale integrative program of research called genes-to-cognition is under way that uses mouse models for functional genomic research in the cognitive domain.66 One of the papers in this issue serves as an example of the value of rodent models for functional research.2 The research brings together neurotransmitter assays, brain anatomy, a broad battery of behavioral measures, a development approach from infancy to adolescence to adulthood, and pharmacology in an experimental study in which epidermal growth factor (EGF) was administered to neonatal rats. Although a test of learning ability did not appear to be affected by the neonatal treatment, other abnormalities were observed in adults but not in adolescents such as sensorimotor gating, motor activity and social interaction in a pattern reminiscent of schizophrenic symptoms and which were ameliorated by clozapine. This research covers a wide range of functional approaches, but the missing link from a functional genomics perspective is genetics. Although transgenic studies indicate the important role of the EGF gene family on brain structures and monoamine pharmacology, there is as yet no evidence that polymorphisms in genes related to EGF are involved in schizophrenia or other cognitive disabilities or abilities. This program of research showing the importance of EGF is likely to stimulate genetic research using EGF candidate genes. In our age of increasing specialization, the most exciting prospect for functional genomic research in the postgenomic era is that DNA will integrate research in the life sciences from cells to societies and that bottom-up approaches will meet top-down approaches in the brain. g is an excellent target for such integrative research because an exciting synergy will quickly emerge simply by connecting the dots of knowledge already available, for example, in gene targeting studies of learning and memory in mice, brain imaging studies of cognitive processes in the human species, and extensive quantitative genetic research. References 1 Comings DE et al. Mol Psychiatry 2002; 7. 2 Futamura T et al. Mol Psychiatry 2002; 7. 4 Payton A et al. Mol Psychiatry 7, in press. 3 Jacobs N et al. Mol Psychiatry 2002; 7: 368-374. Article 5 Spearman C. Am J Psychol 1904; 15: 201-293. 6 Carroll JB. Human Cognitive Abilities. Cambridge University Press: New York, 1993. 7 Jensen AR. The g factor: The Science of Mental Ability. Praeger: Wesport, 1998. 8 Deary IJ. Trends Cogn Sci 2001; 5: 164-170. 9 Deary IJ, Whalley LJ, Lemmon H, Crawford JR, Starr JM. Intelligence 2000; 28: 49-55. Article 10 Gottfredson LS. g: Highly general and highly practical. In: Sternberg RJ, Grigorenko EL (eds). The General Factor of Intelligence: How General is it? Lawrence Erlbaum Associates: Mahwah, NJ, 2002, pp 331-380. 11 Salthouse TA, Czaja SJ. Psychol Aging 2000; 15: 44-55. Article PubMed 12 Zechner U, Wilda M, Kehrer-Sawatzki H, Vogel W, Fundele R, Hameister H. Trends Genet 2001; 17: 697-701. 13 Burks B. Yearbook of the Natl Soc Study Educ, Part 1 1928; 27: 219-316. 14 Freeman FN et al. The influence of environment on the intelligence school achievement and conduct of foster children. Yearbook Natl Soc Study Educ 1928; 27: 103-217. 15 Merriman C. Psychol Monogr 1924; 33: 1-58. 16 Bouchard Jr TJ, McGue M. Science 1981; 212: 1055-1059. PubMed 17 Chipuer HM et al. Intelligence 1990; 14: 11-29. Article 18 Devlin B et al. Nature 1997; 388: 468-471. Article PubMed 19 McGue M et al. Behavioral genetics of cognitive ability: A life-span perspective. In: Plomin R, McClearn GE (eds). Nature Nurture and Psychology. American Psychological Association: Washington, DC, 1993, pp 59-76. 20 Plomin R et al. Behavioral Genetics, 4th Edn. Worth Publishers: New York, 2001. 21 Plomin R. Nature 1999; 402: C25-C29. Article PubMed 22 Petrill SA. The case for general intelligence: a behavioral genetic perspective. In: Sternberg RJ, Grigorenko EL (eds). The General Factor of Intelligence: How General is it? Lawrence Erlbaum Associates: Mahwah, NJ, 2002, pp 281-298. 23 Garlick D. Psychol Rev 2002; 109: 116-136. 24 Detterman DK. General intelligence: cognitive and biological explanations. In: Sternberg RJ, Grigorenko EL (eds). The General Factor of Intelligence: How General is it? Lawrence Erlbaum Associates: Mahwah, NJ, 2002, pp 223-244. 25 Plomin R, Spinath FM. Trends Cogn Sci 2002; 6: 169-176. 26 Posthuma D et al. Nature Neurosci 2002; 5: 83-84. Article PubMed 27 Thompson PM et al. Nature Neuroscience 2001; 4: 1253-1258. 28 Plomin R et al. J Child Psychol Psychiatry 2002; 43: 619-633. 29 Nichols PL. Behav Genet 1984; 14: 161-170. 30 Baker E et al. Am J Med Genet 2002; 107: 285-293. 31 Spinath FM et al. Substantial genetic influence on mild mental impairment in early childhood. American Journal of Mental Retardation, in press. 32 Farrer LA et al. J Am Med Assoc 1997; 278: 1349-1356. 33 Kaplan DE et al. Am J Hum Genet 2002; 70: 1287-1298. Article PubMed 34 Plomin R et al. Science 1994; 264: 1733-1739. PubMed 35 Benjamin J, Ebstein R, Belmaker RH. Molecular Genetics of Human Personality. American Psychiatric Press: Washington, DC, 2002. 36 Cohen J. Statistical Power Analysis for the Behavioral Sciences, 2nd edn. Lawrence Erlbaum Associates: Hillsdale, NJ, 1988. 37 Williams J. Dementia. In: Plomin R, DeFries JC, Craig IW, McGuffin P (eds). Behavioral Genetics in the Postgenomic Era. APA Books: Washington DC, 2002, pp 503-527. 38 Egan MF et al. Proc Natl Acad Sci USA 2001; 98: 6917-6922. Article PubMed 39 Malhotra AK et al. Am J Psychiatry 2002; 159: 652-654. 40 Barbaux S et al. NeuroReport 2000; 11: 1133-1136. 41 Deary IJ et al. The influence of the e4 allele of the apolipoprotein E gene on childhood IQ, intelligence in old age, and lifetime cognitive change. Intelligence, in press. 42 Turic D et al. Neurosci Lett 2001; 299: 97-100. 43 Pendleton N et al. Neurosci Lett 2002; 324: 74-76. 44 Ioannidis JP et al. Nat Genet 2001; 29: 306-309. Article PubMed 45 Chorney MJ et al. Psych Sci 1998; 9: 1-8. Article 46 Hill L et al. A quantitative trait locus not associated with cognitive ability: a failure to replicate. Psych Sci, 2002; 13: 561. 47 Tabor HK et al. Nat Rev Genet 2002; 3: 391-397. Article PubMed 48 Plomin R et al. Intelligence 1995; 21: 31-48. 49 Craig IW, McClay J. The role of molecular genetics in the postgenomics era. In: Plomin R, DeFries JC, Craig IW, McGuffin P (eds). Behavioral Genetics in the Postgenomic Era. APA Books: Washington, DC, 2003, pp 19-40. 50 Plomin R et al. Behav Genet 2001; 31: 497-509. 51 Abecasis GR et al. Am J Hum Genet 2001; 68: 191-197. Article PubMed 52 Reich DE et al. Nature 2001; 411: 199-204. Article PubMed 53 Ardlie KG et al. Nat Rev Genet 2002; 3: 299-309. Article PubMed 54 Gabriel SB et al. Science 2002; 296: 2225-2229. Article PubMed 55 Butcher LM et al. How many Non-synonymous SHPs are available in public databases. American Journal of Medical Genetics 2002; 114: 714. 56 Mattick JS. EMBO Rep 2001; 2: 986-991. Article 57 Norton N et al. Hum Genet 2002; 110: 471-478. Article PubMed 58 Newson A, Williamson R. Bioethics 1999; 13: 327-342. PubMed 59 Pinker S. The blank slate: the modern denial of human nature 2002. 60 Plomin R et al. Behavioral Genetics in the Postgenomic Era. APA Books: Washington, DC, 2003. 61 Plomin R, Crabbe JC. Psychol Bull 2000; 126: 806-828. 62 Crabbe JC. Finding genes for complex behaviors: progress in mouse models of the addictions. In: Plomin R, DeFries JC, Craig IW, McGuffin P. (eds). Behavioral Genetics in the Postgenomic Era. APA Books: Washington, DC, 2003; 291-308. 63 Deary I. Looking Down on Human Intelligence: From Psychometrics to the Brain. Oxford University Press: Oxford, 2000. 64 Anderson B. The g factor in non-human animals. In: Bock GR, Goode JA, Webb K. (eds). The Nature of Intelligence. Wiley (Novartis Foundation Symposium 233): Chichester, 2000, pp 79-95. 65 Plomin R. Nat Rev Genet 2001; 2: 136-141. 66 Grant SGN. An integrative neuroscience program linking genes to cognition and disease. In: Plomin R, DeFries JC, Craig IW, McGuffin P. (eds). Behavioral Genetics in the Postgenomic Era. APA Books: Washington, DC, 2003, pp 123-138. -------------------- Book review J.R. Flynn, What is intelligence? Beyond the Flynn Effect, Cambridge University Press (2007). doi:10.1016/j.intell.2007.03.003 How to Cite or Link Using DOI (Opens New Window) Copyright ┬® 2007 Elsevier B.V. All rights reserved. Richard Lynna, E-mail The Corresponding Author a4 Longwood House, Bristol BS8 3TL, UK Received 2 March 2007; accepted 13 March 2007. Available online 17 April 2007. A warm welcome must be extended to this book in which the author discusses the issues raised by the Flynn Effect. There are two major problems. First, what are the factors responsible for the increase of intelligence that has been observed in a number of countries during the last 80 years or so? Second, why has this increase been so much greater in reasoning ability/fluid intelligence, as measured by the Wechsler similarities and non-verbal tests where it has averaged around 3.6 IQ points a decade, and the Progressive Matrices, where in some samples it has averaged around 7 IQ points a decade, than in tests that measure acquired knowledge/crystallized intelligence (vocabulary, information and arithmetic), where it has averaged only around 0.5 IQ points a decade. Flynn's answer to the problem of the cause of the Flynn Effect is that increases in education have led the people thinking more scientifically and logically (ŌĆ£science has engendered a sea change ŌĆ” formal education played a proximate roleŌĆØ). He uses Piaget's concepts of concrete and formal thought processes to explicate this. Previous generations were as good as later generations at concrete thinking, but more recent generations have advanced to the formal stage where they analyse problems in terms of abstract concepts. But he does not mention that this theory has been disconfirmed by Fleiller, Jautz, and Kop (1989) who demonstrated that concrete thinking has improved at the same rate as formal thinking. Flynn is by no means the first to attribute the Flynn Effect to improvements in education. Many others have done the same, including several of the early observers of the Flynn Effect such as Cattell (1973, p. 275): ŌĆ£the inter-generational changes ŌĆ” probably represent the unquestionably marked improvement in schoolingŌĆØ. The theory that improvements in education can explain the Flynn Effect encounters two problems. The first is that the cognitive abilities that are learned in schools (arithmetic, information, vocabulary, and math, science and reading tested in the American NAEP) have shown very little increase; it is the cognitive skills that are not learned in schools that have shown the large increases. This is the opposite of what would be expected if better or more education has enhanced cognitive abilities. A second problem is that the Flynn Effect has been found in 4ŌĆō6 year olds who have had very little education, and even in infants (e.g. Hanson, Smith, & Hume, 1985). This suggests that an important contributor to the Effect lies in improvements in pre-natal and early post-natal nutrition, as argued in detail in Lynn, 1990 and Lynn, 1998. It may be, however, that some of the large gains in fluid intelligence found in military conscripts are attributable to later cohorts having had more education than earlier. Flynn attempts to refute the nutrition theory of the Flynn Effect by asserting that there is no evidence that nutrition has improved in the second half of the twentieth century. He asserts that there have been no increases in height (improvements in nutrition are indexed by increases in height) in the United States in children born after about 1952, although intelligence has continued to increase. Contrary to this contention (1) the data compiled by Komlos and Lauderdale (in press) show that height in the United States increased in those born from 1955 to 1975 (white men from 177.8 to 179.5; white women from 164.1 to 164.9); (2) height stabilised after 1975 and Flynn's own data show that intelligence gains decelerated after 1985 and turned negative in children from 1989 to 1995. In Europe also heights increased from 1960 to 1990 (Larnkjaer, Schroder et al., 2006); from around 1990 heights and intelligence have both stabilized in Denmark and Norway. The case for improvements in height running parallel with increases in intelligence, as predicted by the nutrition theory, is much stronger that Flynn allows. Furthermore, the nutrition theory of the Flynn Effect explains why fluid intelligence has increased so much more than crystallized intelligence. Several studies have shown that sub-optimal nutrition impairs fluid intelligence more than crystallized intelligence. Hence as nutrition has improved over time, fluid intelligence has increased more. It has even been shown that the Wechsler subtests that are most impaired by sub-optimal nutrition and improve most with nutritional supplements are those for which the Flynn Effects have been the greatest (e.g. arithmetic, similarities and block design) (Botez, Botez, & Maag, 1984). Flynn proposes that the effect of better education on the increase in intelligence is enhanced by the ŌĆ£individual multiplierŌĆØ and the ŌĆ£social multiplierŌĆØ. The concept of the ŌĆ£individual multiplierŌĆØ is that the intelligent have a thirst for cognitive stimulation and this increases their intelligence. This again encounters the problem that the Flynn Effect is present in infants. The ŌĆ£social multiplierŌĆØ posits ŌĆ£that other people are the most important feature of our cognitive development and that the mean IQ of our social environs is a potent influence on our own IQŌĆØ. If this were so, the IQs of adopted children should be associated with the IQs of their adoptive parents, and there should also be a strong correlation between the IQs of unrelated children reared in the same adoptive families. Both these predictions have been disconfirmed. Scarr and Weinberg's (1978) study found that the correlation between the IQs of adopted children aged 18 and the IQs of their adoptive parents was .14 (i.e. zero), while the correlation between the IQs of unrelated children reared in the same adoptive families was ŌłÆ .03. The effectively zero correlation between the IQs of unrelated children reared in the same adoptive families has been confirmed in a study of 52 pairs aged 13 (r = ŌłÆ .16) (Plomin, 1986, p. 237). Although I have not been persuaded by Flynn's arguments on the causes of the Flynn Effect, and I could not find an answer to the question ŌĆ£What is Intelligence?ŌĆØ beyond what is already widely accepted, I found his book to contain many interesting ideas and observations and I recommend it in the confident expectation that many potential readers will find the same. References Botez, M. I., Botez, T., & Maag, U. (1984). The Wechsler subtests in mind organic brain damage associated with folate deficiency. Psychological Medicine, 14, 431ŌłÆ437. Cattell, R. B. (1973). Abilities: Their structure, growth and action. Boston: Houghton Mifflin. Fleiller, A., Jautz, M., & Kop, J. -L. (1989). Les reponses au test mosaique a quarante ans d'intervalle. Enfance, 42, 7ŌłÆ22. Hanson, R., Smith, J. A., & Hume,W. (1985). Achievements of infants on items of the Griffiths scales: 1980 compared with 1950. Child: Care, Health and Development, 11, 91ŌłÆ104. Komlos, J. and Lauderdale, B. E. (in press). The mysterious trend in American heights in the 20 century. Annals of Human Biology. Larnkjaer,A., Schroder, S.A., et al. (2006). Secular change in adult stature has come to a halt in northern Europe and Italy. Acta Paediatrica, 95, 754ŌłÆ755. Lynn, R. (1990). The role of nutrition in secular increases of intelligence. Personality and Individual Differences, 11, 273ŌłÆ285. Lynn, R. (1998). In support of the nutrition theory. In U. Neisser (Ed.), The rising curve: Long term gains in IQ and related matters Washington, D.C.: American Psychological Association. Plomin, R. (1986). Development, Genetics and Psychology. Hillsdale, New Jersey: Lawrence Erlbaum. Scarr, S., & Weinberg, R. A. (1978). The influence of family background on intellectual attainment. American Sociological Review, 43, 674ŌłÆ692. Labels: general intelligence, Genetics, spearman's g Wednesday, March 21, 2007
The Minnesota Study of Twins Reared Apart: The heritability of g and other mental ability factors
Send this entry to: Del.icio.us
Spurl
Ma.gnolia
Digg
Newsvine
Reddit
Wendy Johnson, Thomas Bouchard, and their colleagues have an important paper in press at Intelligence reanalyzing data from the Minnesota Study of Twins Reared Apart (MISTRA). As many of you may be aware, the Minnesota group previously reported a correlation in IQ of 0.75 for 40+ pairs of identical twins reared apart (Bouchard et al., 1990). This implies a broad-sense heritability of 0.75; that is, three quarters of the variance in IQ is ascribable to genetic factors. MISTRA has continued since then, and this latest paper provides an update.
These subjects were administered over 40 ability tests during their participation in MISTRA. In this reanalysis heritabilities were estimated for g in particular and also for lower-order factors such as verbal ability and image rotation. The heritability of g was estimated to be 0.77 (95% CI: 0.66-0.84). Estimated heritabilities for lower-order factors were also substantial. The contribution to the correlation between twins caused by similarity in rearing environments was estimated by multiplying the square of the environment-score correlation by the correlation between twins in the environmental measure. It was found that the contributions to the correlation between twins in g by familial cohesion, expressiveness, conflict, independence, achievement orientation, intellectual-cultural orientation, active-recreational orientation, moral-religious emphasis, organization, and control (all dimensions of the Family Environmental Scale) were all zero to within two decimal places. The contributions by family size, parental occupation, parental education, and possessions in the home (including material, cultural, mechanical, and scientific possessions) ranged from zero to 0.02. Labels: general intelligence, Genetics, IQ Wednesday, March 07, 2007 History The study of intelligence goes back many millennia, but, as such, it was usually defined as a nebulous construct and it fell more under the domain of philosophy than, say, science. Enter Francis Galton. With his Darwinian ancestry and precocious nature, Galton became fascinated by human variability and spent most of his life pursuing various distributaries from this river (e.g., dactylography, anthropology). Most important to the field of individual differences, was his study of the nature of human cognitive abilities. That is, he was one the first (if not the first) to make a systematic study of human variation in cognitive abilities. In doing so, he developed a cadre of "brass instruments" to measure various aspects of basic human abilities, which, to him, were all related to this underlying, general cognitive ability.
While in his time, his elementary task/sensory discrimination data did not support his hypothesis that they were related to other "common sense" criteria such as education and occupation, later, when Fisherian analysis were applied, Galton was proved to be correct--that is, there were group differences in average scores (Johnson, McClearn, Yuen, Nagoshi, Ahern, & Cole, 1985). In addition to his interest in elementary tasks, Galton was also interested in more traditional psychometrics. In fact, he convinced the British Association for the Advancement of Science to conduct a survey of mental capacities throughout British schools. William McDougal was appointed to head this up and his student, Sir Cyril Burt, got his initial taste of the field of applied psychometrics from this project (Burt, 1972). Measurement As important as Galton was in developing the underpinnings to modern intelligence research, he was not able to conceive of a way to measure general cognitive ability. Instead, this task was accomplished by engineer-turned-psychologist Charles Spearman (1904). Spearman was able to accomplish this based on two of his mathematical "inventions:" Classical Test Theory (CTT) and Factor Analysis (FA). Neither one of these is particularly easy to explicate via BLOG form, but the bottom line is: (a) CTT allowed for one to find the correlation between two variables, disattenuated by (random) measurement error; and (b) FA allowed for one to extract commonalities in groups of correlations. That is: If variable A, variable B, and variable C are all highly correlated with each other, then they likely have something in common. FA allows one to "get at" the thing (loosely speaking) that they have in common. For example, if we have the following correlations for A, B, and C, then the last row has the correlations between the variable and the common factor (i.e., factor loadings)
Spearman called that underlying factor general intelligence, and that is still what is meant today when the moniker Spearman's g is used, even though the factor analytic techniques have greatly advanced since Spearman's day. After Spearman's developments, there was a period of controversy as to (a) whether g existed, (b) if it existed, was it the only factor that could be extracted, and (c) if other factors could be extracted, could g be extracted at the same time? The details of this (needless?) argumentation need not concern this post (for a succinct summary, see Carroll, 1993), with the eventual conclusion being that, given a sufficient diversity of tests, g could be extracted, but other, more primary factors (e.g., Working memory, Long-term memory, Quantitative knowledge) could also be extracted. A picture is given below: 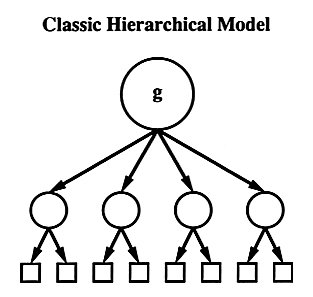 Spearman's g is at the apex, the more primary ability are the circles below, and the tests from which the factors were extracted are represented by the boxes [the circles are used as that is the common way of representing latent variables; likewise, boxes are common way of representing manifest variables] IQ Around the same time Spearman and his London School contemporaries were doing their work in g theory, the field of intelligence testing was arising--due in large part to Binet and Simon's work in France, Goddard and Terman's work in the US, and Burt's work in the UK. Today, intelligence is often used synonymously with IQ scores, which, outside of differential psychology and psychometrics, is also used synonymously with Spearman's g. They are similar concepts, undoubtedly, but they need distinction. Intelligence. A nebulous construct at best, it had eluded a century of definition, and, in Arthur Jensen's (1998) own words, "psychologists are incapable of reaching a consensus on its definition" (p. 48) As it cannot be defined, we will not use it any further. Spearman's g. It is the primary factor extracted from the correlation matrix of a group of variables that all measure some aspect of cognitive ability. That is, it is the part of the covariance that all the variables have in common with each other. Intelligence Quotient (IQ). An imperfect measure of Spearman's g. That is, in modern IQ tests, IQ scores are the weighted average of performance all the subtests involved. This is sometimes referred to as "intelligence in general" as opposed to "general intelligence" (i.e., Spearman's g), but for general purposes an IQ score can be thought of as rough measure of Spearman's' g, plus some (random) measurement error. Usually these scores are scaled such that most people will have a score between 90 and 110; mental retardation is a serious consideration for people with IQs below 70, as giftedness is a serious consideration for people with IQs greater that 120. Why All the Fuss? As presented, one may easily come to the conclusion of, so what? IQ/g sounds like it is another entry in the massive world of psychobabble, along with mental bonds, closure, and life coaching. The fuss is this:
And this is to just name a few. If I were to stop here, one might be under the impression that g/IQ are important, but (a) there are other forms of "intelligence"; and (b) that IQ is just a product of the environment and can be raised (almost) at will. Multiple Intelligences The theory of Multiple Intelligences (MI) stems from Howard Gardner who (now) posits that g exists, but so do other forms of independent "intelligences" that (equally) predict life success. His other forms are things like interpersonal skills, intrapersonal knowledge, and kinesthetic ability. Since in the 25 years since MI has been around, Gardner has refused to test his hypotheses, it really is not even worth mentioning anymore. Thus, I won't (for some empirical work showing why Gardner is, well, wrong, see Visser, Ashton, & Verson, 2006, under review). Triarchic Theory of Intelligence This works stem from the work of Robert Sternberg, and his theory of cognitive ability that, similar to Gardner, posits that g exists, but that there are independent cognitive entities that are useful in life, such as practical intelligence; he even goes so far as to say that these independent entities are better predictors of life outcomes than g. Unfortunately, like Gardner, he doesn't readily submit his theories to much empiricism, and his claims, to date, are unsubstantiated (for an excellent critique, see Gottfredson, 2003). Stability and Raising g/IQ If one is under the impression that the environment can have massive influence on g, the logical product of that belief is that massive government programs should be able to raise cognitive abilities. In short, they do not. They produce short-term gains, but the gains do not last long (see, for example, Spitz, 1986, 1992). This is not to say that other things, such as nutritional supplementation, might not be able to increase cognitive performance, but massive environmental programs, at least as implemented in the past 50 years, have not. Moreover, IQ scores measured when one is 10ish are consistent, very consistent, with IQ scores measured almost 70 years later on the same individuals (Deary, Whalley, Lemmon, Crawford & Starr, 2000). That is, despite a life's worth of diversity of experience, your IQ when you are in Middle School is very predictive of your IQ when you retire. Take Home Message g is ubiquitous in cognitive tasks, it is stable across time in individuals, and no other variable in the history of psychology has been able to predict so many life outcomes, so well. References Burt, C. L. (1972). Inheritance of general intelligence. American Psychologist, 27, 175ŌĆō190 Carroll, J.B. (1993) Human cognitive abilities. Cambridge University Press. Deary, I. J., Whalley, L. J., Lemmon, H., Crawford, J. R., & Starr, J. M. (2000). The stability of individual differences in mental ability from childhood to old age: Follow-up of the 1932 Scottish Mental Survey. Intelligence, 28, 49-55. Deary, I. J., Strand, S., Smith, P., & Fernandes, C. (2007). Intelligence and educational achievement. Intelligence, 35, 13-21. Ellis, L., & Walsh, A. (2003). Crime, delinquency, and intelligence: A review of the worldwide literature. In H. Nyborg (Ed.), The scientific study of general intelligence: Tribute to Arthur R. Jensen (pp. 343-365). New York: Pergamon. Galton, F. (1869). Hereditary genius: An inquiry into its laws and consequences. London: MacMillan Gottfredson, L. S. (Ed.) (1986). The g factor in employment. Journal of Vocational Behavior, 29 (3). (Special Issue) Gottfredson, L. S. (2003). Dissecting practical intelligence theory: Its claims and evidence. Intelligence, 31(4), 343-397. Gottfredson, L. S. (2004). Intelligence: Is it the epidemiologists' elusive "fundamental cause" of social class inequalities in health? Journal of Personality and Social Psychology, 86, 174-199. Gottfredson, L., & Deary, I. J. (2004). Intelligence predicts health and longevity: but why? Current Directions in Psychological Science, 13, 1-4. Herrnstein, R. & Murray (1994) The Bell Curve: Intelligence and class structure in american life. New York: Free Pres Jensen, A. R. (1998). The g factor. Westport, CT: Praeger. Jensen, A.R. (2006). Clocking the mind: Mental chronometry and individual differences. Oxford: Elsevier. Johnson, R. C., McClearn, G. E., Yuen, S., Nagoshi, C. T., Ahern, F. M., & Cole, R. E. (1985). GaltonŌĆÖs data a century later. American Psychologist, 40, 875ŌĆō892 Kuncel, N. R., Hezlett, S. A., & Ones, D. S. (2004). Academic performance, career potential, creativity, and job performance: Can one construct predict them all? Journal of Personality and Social Psychology, 86, 148-161. Lynn R. (2005). Race differences in intelligence: An evolutionary analysis. Augusta, GA: Washington Summit. Lynn, R. and Irwing, P. (2004) Sex differences on the Progressive Matrices: a meta-analysis. Intelligence, 32, 481-498. Lynn, R. & Vanhanen, T. (2006). IQ and global inequality. Atlanta, GA: Washington Summit. Rushton, J. P., & Jensen, A. R. (2005). Thirty years of research on race differences in cognitive ability. Psychology, Public Policy, and Law, 11, 235-294. Schmidt, F. L., & Hunter, J. (1998). The validity and utility of selection methods in personnel psychology practical and theoretical implications of 85 years of research findings. Psychological Bulletin, 124, 262-274. Schmidt, F. L., & Hunter, J. (2004). General mental ability in the world of work: Occupational attainment and job performance. Journal of Personality and Social Psychology, 86, 162-173. Spearman, C. E. (1904). ŌĆ£General intelligenceŌĆØ: Objectively defined and measured. American Journal of Psychology, 15, 201ŌĆō292. Spitz, H. H. (1986). The raising of intelligence: A selected history of attempts to raise retarded intelligence. Lawrence Erlbaum Associates. Spitz, H. H. (1992). Does the Carolina Abecedarian Early Intervention Project prevent sociocultural mental retardation? Intelligence, 16, 225-237 Visser, B.A., Ashton, M.C., & Verson, P.A. (under review). Self-estimated general and "multiple" intelligence(s): Accuracy, sex differences, and personality. Visser, B.A., Ashton, M.C., & Verson, P.A. (2006). Beyond g: putting Multiple Intelligences theory to the test. Intelligence, 34, 487-502. Labels: general intelligence, spearman's g Tuesday, March 06, 2007
In IQ and the Wealth of Nations (2002; IQatWoN) and IQ and Global Inequality (2006; IQGI), Richard Lynn and Tatu Vanhanen (L&V) present measurements and estimates of average national IQ (national IQ). In IQatWoN, L&V argue that national IQ predicts per-capita GDP (sup Fig 1). In IQGI, L&V argue that national IQ predicts quality of life measures (sup Fig 2). A common criticism of both works is to question the validity of national IQ. This criticism is motivated in part by the very low scores reported for countries in sub-Saharan African. A look at the distribution of national IQ is instructive (Fig 1).
Figure 1. The distribution of national IQ values (192 countries from IQGI). 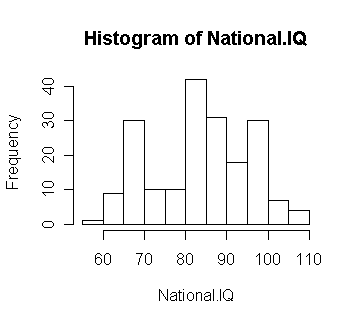 L&V address the issue of validity by comparison of national IQ values with international test scores in math and science such as TIMSS and PISA. IQGI presents data from 10 different tests, with different scoring scales, in the form of 3 tables. To get a better grasp on the question of the validity of national IQ, I reanalyzed the test score data from IQGI. For better comparison, I renormalized each set of test scores relative to the maximum test score for each assessment. This is an imperfect but sufficient technique. An unweighted average of the available test score data was used to calculate a composite national test score for the set of 62 countries for which at least 1 test score was available (Fig 2). Figure 2. The association between national test scores and national IQ for 62 nations. 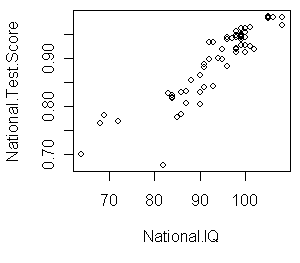 National test scores are available for a limited range of national IQ scores, with few test scores available for countries with national IQs below the mid 80s. I interpret this to mean that for countries with national IQs below ~85, the test score data is insufficient to inform the question of validity. However, for the available scores (i.e., mostly above ~85), the relationship between national IQ and national test scores is very strong (see Sup Table 1). The validity of sub-80 national IQs is addressed in part by the finding that IQ correlates with GDP and QHC (Sup Figs 1,2) throughout the observed range of IQ. Update: Although there are only four values, the sub-80 national IQs are outliers, all with positive residuals. While this is hardly informative, it trends in the direction of casting doubt on the validity of sub-80 national IQ values. Supplemental Figure 1. National IQ correlates with GDP per-capita (192 countries from IQGI). 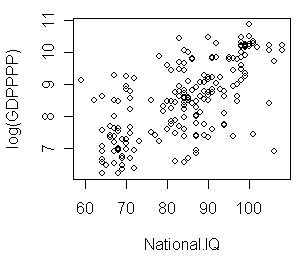 Supplemental Figure 2. National IQ correlates with a L&V's quality-of-life index (QHC; 192 countries from IQGI). 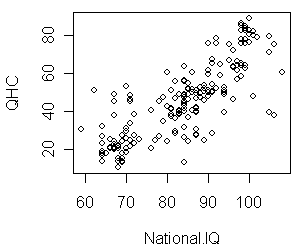 Supplemental Table 1. Correlation matrix for national IQ (IQ), national test score (Test), L&V's quality of life index (QHC) and log per-capita GDP (logGPD) for 62 countries.
Related papers: * Earl Hunt and Werner Wittmann, National intelligence and national prosperity, Intelligence, In Press --examines PISA scores * Richard Lynn and Jaan Mikk, National differences in intelligence and educational attainment, Intelligence, Volume 35, Issue 2, March-April 2007, Pages 115-121. --examines TIMSS scores Labels: general intelligence Tuesday, February 27, 2007
CHRM2 Gene Variants Associated with Intelligence
Prior GNXP references to CHRM2: Thompson and Gray: Neuroscience, genes, and IQ More red meat Labels: general intelligence, Genetics Thursday, February 22, 2007
Jensen (1998) makes a point that is worth repeating:
The pernicious notion that IQ discriminates mainly along racial lines, however, is utterly false. Jensen presents what should be a predictable pattern for a highly heritable trait:
This can be demonstrated most clearly in terms of a statistical method known as the analysis of variance. Table 11.1 shows this kind of analysis for IQ data obtained from equal-sized random samples of black and white children in California schools. Their parents' social class (based on education and occupation) was rated on a ten-point scale. In the first column in Table 11.1 the total variance of the entire data set is of course 100 percent and the percentage of total variance attributable to each of the sources6 is then listed in the first column. We see that only 30 percent of the total variance is associated with differences between race and social class, whereas 65 percent of the true-score variance is completely unrelated to IQ differences between the races and social classes, and exists entirely within each racial and social class group. The single largest source of IQ variance in the whole population exists within families, that is, between full siblings reared together in the same family. The second largest source of variance exists between families of the same race and the same social class. The last column of Table 11.1 shows what happens when each of the variances in the first column is transformed into the average IQ difference among members of the given classification. For example, the average difference between blacks and whites of the same social class is 12 IQ points. The average difference between full siblings (reared together) is 11 IQ points. Measurement error (i.e., the average difference between the same person tested on two occasions) is 4 IQ points. (By comparison, the average difference between persons picked at random from the total population is 17 IQ points.) Persons of different social class but of the same race differ, on average, only 6 points, more or less, depending on how far apart they are on the scale of socioeconomic status (SES). What is termed the interaction of race and social class (8 percent of the variance) results from the unequal IQ differences between blacks and whites across the Spectrum of SES, as shown in Figure 11.2. This interaction is a general finding in other studies as well. Typically, IQ in the black population is not as differentiated by SES as in the white population, and the size of the mean W-B difference increases with the level of SES. Labels: general intelligence, race Sunday, February 11, 2007 Wherever the abilities involved are sufficiently distinct--and that is in the great majority of cases--our tetrad equation is satisfied with surprising exactitude, so that here each ability must be divisible into g and s. The letter g becomes, in this manner, a name for the factor--whatever it may be--that is common to mental tests of such a description. This is the very definition of g. (Spearman, 2005, p. 161) General intelligence (g) has been one of the most, if not the most, aggressively studied constructs in psychology. Type the search string "general intelligence" in PsycInfo and you will return over 2000 entries, and a similar search in Pubmed pulls up over 400. If you broaden the term to just "intelligence", the respective number of entries are 65405 and 37166. While not all of the results focus on g , (e.g., AI, "social intelligence"), a large portion of them do, and the prospect of meandering your way through can be intimidating. Fortunately, the overall literature is consistent and, at least for me, highly engaging. The study of g can be bifurcated into two distinct areas: vertical and horizontal g . Vertical g is the domain that studies g's biological relationships. It is the area that is going to eventually assimilate enough data and literature to elucidate, unquestionably, the causal mechanisms of g . From this field of study, we know that g is correlated with a variety of neural mechanisms, such at glucose metabolism (Haier, 2003), cortical development (Shaw et al., 2006), and biochemical activity (Jung et al., 2005). We know that g is highly heritable, both when measured psychometrically (Plomin & Spinath, 2002) or chronometrically (Beaujean, 2005). We know that g decreases with inbreeding (Jensen, 1983) and increases with hybrid vigor (Nagoshi & Johnson, 1986). As genome scanning becomingmore popular, we are now even beginning to see some specific genes that are implicated g. As interesting as vertical g is, however, this entry is going to instead focus in the horizontal aspects of g . That is, how does g play out into "everyday life." Specifically, we will look three different, although related, areas: education, occupation, and general life outcomes. The reasons for doing so are twofold: (a) the more the science of horizontal g is positively promulgated, then, perhaps, the more likely people are to support the needed research into vertical g and (b) even though this area of research has been around for over a century (e.g., Galton, 1869), there are still new, important findings. Before delving into horizontal g, however, it would behoove us to delineate a mechanism by which g could influence education, occupation, and general life outcomes.For our purposes, that mechanism is information processing. Generally defined, information processing is the pathway and mechanisms by which stimuli are perceived, attended to, retrieved, and/or used to solve problems and/or cope with exigencies in the environment (Jensen, 1998a). The cognitive psychology literature is chalked full of the nuances of the various information-processing theorists, the specifics are which cannot be delineated here (an easy-to-read intro: Ormrod, 2004). Yet, within all these theories lies the idea that people respond to stimuli in a way that involves many mechanisms (e.g., sensory register, primary memory)and a variety of neurological regions (e.g., hippocampus, amygdala, mammillary bodies). The consequence? There is ample room for individual differences in the speed and efficiency in which information is processed. From another perspective (e.g., Kline, 1998), information is processed in irreducibly small pieces (often called bits) and the time it takes to process those bits is the BIP, the Basic period of Information Processing. Now, the time it takes Johnny to process the fact that the only integer between 2 and 4 is 3 is going to be different than the time it takes Jane. Multiply those differences by the number of people processing the fact, and voila! individual differences. Educational Outcomes This is probably the area most replete with data and, unsurprisingly, the g-educational achievement relationship is strong. In fact, although it differs by grade level (with it decreasing as grade level increases), most of the non-random variance in scholastic performance is accounted for by g (Thorndike, 1984). Jensen (1989, 1998b) writes that this is so due to the fact that "school learning" is, itself, quite g -loaded. Of course, there are those who write that g is just a product of education (e.g., Ceci, 1991; for a review of others, see Gottfredson, 1986), or, perhaps more egregious, that g and educational achievement are just products of the tests designed to measure them (for review and rebuttal, see Jensen, 1984). But these arguments quickly dissipate when looking at the evidence. For example, in the latest issue of Intelligence, there were two longitudinal studies (Deary, Strand, Smith, & Fernandes, 2007; Watkins, Lei, & Canivez, 2007) that showed a strong IQ --> Educational Achievement relationship (approx. 70 from Deary), but reverse (i.e., EA --> IQ) was not there (from the Watkins study). Further evidence comes from the two major "We can improve you Education by improving your IQ" projects: Head Start and the Abecedarian Study. With regard to the former, Head Start just does not produce long-term IQ gains and, hence, does not produce long-term academic gains (Caruso, Taylor, & Detterman, 1982; Holden, 1990; Kreisman, 2003). With regard to the latter, while there has been acrimonious debate, the overall conclusion is that, like Head Start, the initial IQ gains do not last, giving even more evidence that educational achievement cannot be raised independently of g (Spitz, 1986, 1992, 1993b, 1993a). Yet another line for arguing against the prominence of g in education is the idea that there are other traits that are just as necessary for academic success, such as motivation, personality, etc. To risk sounding like to broken record, the data shows that these traits are not nearly as potent predictors as g in predicting academic outcomes. For example, Gagne and St. Pere (2002) gives us reason to believe that motivation might just be an impotent variable in predicting academic achievement. Likewise, Laidra, Pullmann, and Allik (2007) have shown that while personality factors contribute some to the variance in educational achievement, they are dwarfed in comparison to the contribution of g. Occupational Outcomes There are many theories as to how g and occupational outcomes relate (see Gottfredson, 1986), but the one that is most supported by data is best explicated by Frank Schmidt and John Hunter [g] predicts both the occupational level attained by individual and their performance within their chosen occupation. [g] correlates above .50 with later occupational level, performance in job training programs, and performance on the job. Relationships this large are rare in psychological literature and are considered "large" . . . weighted combinations of specific aptitudes (e.g., verbal, spatial, or quantitative aptitude) tailored to individual jobs do not predict job performance better than [g] measures alone, thus disconfirming the specific aptitude theory. It has been proposed that job experience is a better predictor of job performance than [g], but the research findings . . . support the opposite conclusion. . . . Nearly 100 years ago Spearman (1904) proposed that the construct of [g] is central to human affairs. The research . . . supports his proposal in the world of work, an area of life critical to individuals, organizations, and the economy as a whole.(Schmidt & Hunter, 2004, p.171; cf.Schmidt & Hunter, 1998) One could argue that, given the high g -education relationship, that the g-occupation relationship is just a natural outgrowth.That is, once education is controlled, the g-occupation relationship significantly shrinks. But to make that argument, one would have to have a Sternberg-like approach to intelligence (Sternberg & Wagner, 1993). That is, that the cognitive skills needed for a successful education are somehow vastly different than those needed for everyday life. The data, however, indicate that the same generative process that tends to makes one successful in the educational arena is also the mechanism that tends to make one successful in the occupational arena: g (Kuncel, Hezlett, & Ones, 2004). This is not to say that other things are not important in occupational or educational outcomes; but, as with education, they are not nearly as potent predictors (Gottfredson, 2002). Life Outcomes Over the last decade or so, an area that has become of more interest to the intelligence community is the influence of g on general life outcomes. That is, beyond educational and occupational outcomes, does g contribute to life success? The answer here, too, seems to be a resounding yes. IQ scores [a proxy for g] predict a wider range of important social outcomes and they correlate with more personal attributes than perhaps any other psychological trait. The ubiquity and often-considerable size of g's correlations across life's various domains suggest g truly is important in negotiating the corridors of daily life. (Gottfredson, 2003, p. 326) But how does g relate to general life outcomes? Believe it or not, it appears that the same information-processing mechanisms that are so potent for educational and occupational outcomes also play a role in day-to-day life (Gottfredson & Deary, 2004). Gottfredson (2003, 2004b) elaborates this mechanism as follows: Life is is made up of many tasks with a wide array of complexity (Gordon, 1997). In the US and most Western nations, society is "free enough" for competence (read: g ) to make a substantial difference in who succeeds in life. As those who have "higher g" are more able to tackle the day-to-day activities of life successfully with less exerted effort, they are able to progress in life with fewer impediments (e.g., untreated illness, accidents; Gottfredson, 2004a), thus allowing them to (a) have more resources to successfully compete and (b) be able to use their resources more efficiently. This then not only allows for a higher probability of achieving satisfying life outcomes (e.g., adequate income, occupational autonomy), but also allows for a lower probability of being involved with unsatisfying life outcomes (e.g., having children without means to support them, crime/delinquency) (cf. Ellis & Walsh, 2003; Herrnstein & Murray, 1996) Conclusion Given the ubiquity of g in fostering success in many life outcomes from education achievement to occupational success, from health outcomes to criminal recidivism, social science in general and psychological science in particular would be remiss to "pretend it doesn't matter" (Gottfredson, 2000). Rather, if these fields want to strengthen their scientific integrity and acumen, they should do exact opposite. That is, bring the large, cumulative database on g and its influence on life outcomes to the forefront of a wide array of research agendas so that this corpus of data can serve as the strong underlying foundation of a generation of new investigations on g's life implications. While this line of investigation may never get to the underlying (vertical) mechanisms by which g operates, it can help foster the acceptance of doing such research and pave the way for its societal implications, whatever they may be. References Beaujean, A. A. (2005). Heritability of mental processing speed as measured by mental chronometric tasks: A review and meta-analysis. Intelligence, 33, 187-201. Caruso, D. R., Taylor, J. J., & Detterman, D. K. (1982). Intelligence research and intelligent policy. In D. K. Detterman & R. J. Sternberg (Eds.), How and how much can intelligence be increased? (pp. 45-65). Norwood, NJ: Ablex. Ceci, S. J. (1991). How much does schooling influence general intelligence and its cognitive components? A reassessment of the evidence. Developmental Psychology, 27, 703-722. Deary, I. J., Strand, S., Smith, P., & Fernandes, C. (2007). Intelligence and educational achievement. Intelligence, 35, 13-21. Ellis, L., & Walsh, A. (2003). Crime, deliquency, and intelligence: A review of the worldwide literature. In H. Nyborg (Ed.), The scientific study of general intelligence: Tribute to Arthur R. Jensen (pp. 343-365). New York: Pergamon. Gagne, F., & St. Pere, F. (2002). When IQ is controlled, does motivation still predict achievement? Intelligence, 30, 71-100. Galton, F. (1869). Hereditary genius: An inquiry into its laws and consequences. London: MacMillan. Gordon, R. A. (1997). Everyday Life as an Intelligence Test: Effects of Intelligence and Intelligence Context. Intelligence, 24, 203-320. Gottfredson, L. S. (1986). Societal consequences ofthe g factor in employment. Journal of vocational behavior, 29, 379-410. Gottfredson, L. S. (2000). Pretending that intelligence doesn't matter. Cerebrum, 2, 75-96. Gottfredson, L. S. (2002). g: Highly general and highly practical. In R. J. Sternberg & E. L. Grigorenko (Eds.), The general factor of intelligence: How general is it? (pp. 331-380). Mahwah, NJ: Erlbaum. Gottfredson, L. S. (2003). g, jobs, and life. In H. Nyborg (Ed.), The scientific study of general intelligence: Tribute to Arthur R. Jensen (pp. 293-342). New York: Pergamon. Gottfredson, L. S. (2004a). Intelligence: Is it the epidemiologists' elusive "fundamental cause" of social class inequalities in health? Journal of Personality and Social Psychology, 86, 174-199. Gottfredson, L. S. (2004b). Life, death, and intelligence. Journal of Cognitive Education and Psychology, 4, 23-46. Gottfredson, L. S., & Deary, I. J. (2004). Intelligence predicts health and longevity, but why? Current Directions in Psychological Science, 13, 1-4. Haier, R. J. (2003). Brain imaging studies of intelligence: Individual differences and neurobiology. In R. J. Sternberg, J. Lautrey, & T. I. Lubart (Eds.), Models of intelligence: International perspectives (pp. 185-193). Washington, DC: American Psychological Association. Herrnstein, R. J., & Murray, C. (1996). Bell curve: Intelligence and class structure in American life. New York: Free Press. Holden, C. (1990, March 23). Head Start enters adulthood. Science, 247, 1402. Jensen, A. R. (1983). The effects of inbreeding on mental ability factors. Personality and Individual Differences, 4, 71-87. Jensen, A. R. (1984). Test validity: g versus the specificity doctrine. Journal of Social and Biological Structures, 7, 93-118. Jensen, A. R. (1989). The relationship between learning and intelligence. Learning and Individual Differences, 1, 37-62. Jensen, A. R. (1998a). The g factor and the design of education. In R. J. Sternberg & W. M. Williams (Eds.), Intelligence, instruction, and assessment: Theory into practice (pp. 111-131). Mahwah, NJ: Lawrence Erlbaum. Jensen, A. R.(1998b). The g factor: The science of mental ability. Westport, CN: Praeger. Jung, R. E., Haier, R. J., Yeo, R. A., Rowland, L. M., Petropoulos, H., Levine, A. S., et al. (2005). Sex differences in N-acetylaspartate correlates of general intelligence: An 1H-MRS study of normal human brain. Neuroimage, 1, 965-972. Kline, P. (1998). The new psychometrics: Science, psychology and measurement. London: Routledge. Kreisman, M. B. (2003). Evaluating academic outcomes of Head Start: An application of general growthmixture modeling. Early Childhood Research Quarterly, 18, 238-254. Kuncel, N. R., Hezlett, S. A., & Ones, D. S. (2004). Academic performance, career potential, creativity, and job performance: Can one construct predict them all? Journal of Personality and Social Psychology, 86, 148-161. Laidra, K., Pullmann, H., & Allik, J. (2007). Personality and intelligence as predictors of academic achievement: A cross-sectional study from elementary to secondary school. Personality and Individual Differences, 42, 441-451. Nagoshi, C. T., & Johnson, R. C. (1986). The ubiquity of g. Personality and Individual Differences, 7, 201-207. Ormrod, J. E. (2004). Human learning (4th ed.). Upper Saddle River, NJ: Pearson. Plomin, R., & Spinath, F. M. (2002). Genetics and general cognitive ability (g). Trends in Cognitive Science, 6, 169-176. Schmidt, F. L., & Hunter, J. (1998). The validity and utility of selection methods in personnel psychology practical and theoretical implications of 85 years of research findings. Psychological Bulletin, 124, 262-274. Schmidt, F. L., & Hunter, J. (2004). General mental ability in the world of work: Occupational attainment and job performance. Journal of Personality and Social Psychology, 86, 162-173. Shaw, P., Greenstein, D., Lerch, J., Clasen, L., Lenroot, R., Gogtay, N., et al. (2006, Mar 30). Intellectual ability and cortical development in children and adolescents. Nature, 440, 676-679. Spearman, C. E.(1904). "General intelligence": Objectively defined and measured. American Journal of Psychology, 15, 201-292. Spearman, C. E.(2005). The abilities of man: Their nature and measurement. New York: Blackburn Press (Original work published 1927). Spitz, H. H. (1986). The raising of intelligence: A selected history of attempts to raise retarded intelligence. Hillsdale, NJ: Lawrence Erlbaum Associates. Spitz, H. H.(1992). Does the Carolina Abecedarian Early Intervention Project prevent sociocultural mental retardation? Intelligence, 16, 225-237. Spitz, H. H. (1993a). Spitzs reply to Ramey's response to Spitz's first reply to Ramey's first response to Spitz's critique of the Abecedarian Project. Intelligence, 17, 31-35. Spitz, H. H. (1993b). When prophecy fails: On Ramey's response to Spitz's critique of the Abecedarian Project. Intelligence, 17, 17-23. Sternberg, R. J., & Wagner, R. K. (1993). The g-ocentric view of intelligence and job performance is wrong. Current Directions in Psychological Science, 2, 1-5. Thorndike, R. L.(1984). Intelligence as information processing: The mind and the computer. Bloomington, IL: Center on Evaluation, Development, and Research. Watkins, M., Lei, P. W., & Canivez, G. L. (2007). Psychometric intelligence and achievement: A cross-lagged panel analysis. Intelligence, 35, 59-68. Labels: education, general intelligence, jobs |
 Subscribe to feed Razib also blogs at..... Resources: Contact GNXP Wiki Archives Search site ATOM feed GNXP forum All Movable Type entries Meet other GNXP readers: Previous Posts Heights of comedians: Average Joes Behavioral Economics and IQ Coevolution of Male and Female Genital Morphology ... Pro forma hand wringing? A simpler Middle East Tasmanian Aboriginal DNA not extracted... Romney on evolution Terror from the skies.... Neutral origins of complexity? Long distance migration.... Archives July 2005 August 2005 September 2005 October 2005 November 2005 December 2005 January 2006 February 2006 March 2006 April 2006 May 2006 June 2006 July 2006 August 2006 September 2006 October 2006 November 2006 December 2006 January 2007 February 2007 March 2007 April 2007 May 2007 Hello Movable Type archives August 11,2002 August 18,2002 August 25,2002 September 01,2002 September 15,2002 October 20,2002 December 08,2002 December 22,2002 December 29,2002 January 05,2003 January 12,2003 January 19,2003 January 26,2003 February 02,2003 February 09,2003 February 16,2003 February 23,2003 March 02,2003 March 09,2003 March 16,2003 March 23,2003 March 30,2003 April 06,2003 April 13,2003 April 20,2003 April 27,2003 May 04,2003 May 11,2003 May 18,2003 May 25,2003 June 01,2003 June 08,2003 June 15,2003 June 22,2003 June 29,2003 July 06,2003 July 13,2003 July 20,2003 July 27,2003 August 03,2003 August 10,2003 August 17,2003 August 24,2003 August 31,2003 September 07,2003 September 14,2003 September 21,2003 September 28,2003 October 05,2003 October 12,2003 October 19,2003 October 26,2003 November 02,2003 November 09,2003 November 16,2003 November 23,2003 November 30,2003 December 07,2003 December 14,2003 December 21,2003 December 28,2003 January 04,2004 January 11,2004 January 18,2004 January 25,2004 February 01,2004 February 08,2004 February 15,2004 February 22,2004 February 29,2004 March 07,2004 March 14,2004 March 21,2004 March 28,2004 April 04,2004 April 11,2004 April 18,2004 April 25,2004 May 02,2004 May 09,2004 May 16,2004 May 23,2004 May 30,2004 June 06,2004 June 13,2004 June 20,2004 June 27,2004 July 04,2004 July 11,2004 July 18,2004 July 25,2004 August 01,2004 August 08,2004 August 15,2004 August 22,2004 August 29,2004 September 05,2004 September 12,2004 September 19,2004 September 26,2004 October 03,2004 October 10,2004 October 17,2004 October 24,2004 October 31,2004 November 07,2004 November 14,2004 November 21,2004 November 28,2004 December 05,2004 December 12,2004 December 19,2004 December 26,2004 January 02,2005 January 09,2005 January 16,2005 January 23,2005 January 30,2005 February 06,2005 February 13,2005 February 20,2005 February 27,2005 March 06,2005 March 13,2005 March 20,2005 March 27,2005 April 03,2005 April 10,2005 April 17,2005 April 24,2005 May 01,2005 May 08,2005 May 15,2005 May 22,2005 May 29,2005 June 05,2005 June 12,2005 June 19,2005 June 26,2005 July 03,2005 July 17,2005 August 07,2005 Blogspot archives June 2002 July 2002 August 2002 September 2002 October 2002 November 2002 December 2002
10 questions for....
Parag Khanna James Flynn Jon Entine Gregory Clark György Buzsáki Heather Mac Donald Bruce Lahn A.W.F. Edwards Luigi Luca Cavalli-Sforza Joseph LeDoux Matthew Stewart Charles Murray James F. Crow Adam K. Webb Justin L. Barrett David Haig Judith Rich Harris Ken Miller Dan Sperber Warren Treadgold Armand M. Leroi John Derbyshire
Blogs
The GiveWell Blog Your Religion Is False Colby Cosh Steve Hsu Audacious Epigone Catallaxy Files Inductivist 2 Blowhards Genetic Future Agnostic Steve Sailer Dienekes Derek Lowe Razib Khan Razib at Comment is Free Secular Right Glenn Reynolds Jim Miller Kevin McGrew John Hawks Peter Fost Randall Parker Less Wrong Charles Murray Carl Zimmer EconLog Marginal Revolution
Principles of Population Genetics
Genetics of Populations Molecular Evolution Quantitative Genetics Evolutionary Quantitative Genetics Evolutionary Genetics Evolution Molecular Markers, Natural History, and Evolution The Genetics of Human Populations Genetics and Analysis of Quantitative Traits Epistasis and Evolutionary Process Evolutionary Human Genetics Biometry Mathematical Models in Biology Speciation Evolutionary Genetics: Case Studies and Concepts Narrow Roads of Gene Land 1 Narrow Roads of Gene Land 2 Narrow Roads of Gene Land 3 Statistical Methods in Molecular Evolution The History and Geography of Human Genes Population Genetics and Microevolutionary Theory Population Genetics, Molecular Evolution, and the Neutral Theory Genetical Theory of Natural Selection Evolution and the Genetics of Populations Genetics and Origins of Species Tempo and Mode in Evolution Causes of Evolution Evolution The Great Human Diasporas Bones, Stones and Molecules Natural Selection and Social Theory Journey of Man Mapping Human History The Seven Daughters of Eve Evolution for Everyone Why Sex Matters Mother Nature Grooming, Gossip, and the Evolution of Language Genome R.A. Fisher, the Life of a Scientist Sewall Wright and Evolutionary Biology Origins of Theoretical Population Genetics A Reason for Everything The Ancestor's Tale Dragon Bone Hill Endless Forms Most Beautiful The Selfish Gene Adaptation and Natural Selection Nature via Nurture The Symbolic Species The Imitation Factor The Red Queen Out of Thin Air Mutants Evolutionary Dynamics The Origin of Species The Descent of Man Age of Abundance The Darwin Wars The Evolutionists The Creationists Of Moths and Men The Language Instinct How We Decide Predictably Irrational The Black Swan Fooled By Randomness Descartes' Baby Religion Explained In Gods We Trust Darwin's Cathedral A Theory of Religion The Meme Machine Synaptic Self The Mating Mind A Separate Creation The Number Sense The 10,000 Year Explosion The Math Gene Explaining Culture Origin and Evolution of Cultures Dawn of Human Culture The Origins of Virtue Prehistory of the Mind The Nurture Assumption The Moral Animal Born That Way No Two Alike Sociobiology Survival of the Prettiest The Blank Slate The g Factor The Origin Of The Mind Unto Others Defenders of the Truth The Cultural Origins of Human Cognition Before the Dawn Behavioral Genetics in the Postgenomic Era The Essential Difference Geography of Thought The Classical World The Fall of the Roman Empire The Fall of Rome History of Rome How Rome Fell The Making of a Christian Aristoracy The Rise of Western Christendom Keepers of the Keys of Heaven A History of the Byzantine State and Society Europe After Rome The Germanization of Early Medieval Christianity The Barbarian Conversion A History of Christianity God's War Infidels Fourth Crusade and the Sack of Constantinople The Sacred Chain Divided by the Faith Europe The Reformation Pursuit of Glory Albion's Seed 1848 Postwar From Plato to Nato China: A New History China in World History Genghis Khan and the Making of the Modern World Children of the Revolution When Baghdad Ruled the Muslim World The Great Arab Conquests After Tamerlane A History of Iran The Horse, the Wheel, and Language A World History Guns, Germs, and Steel The Human Web Plagues and Peoples 1491 A Concise Economic History of the World Power and Plenty A Splendid Exchange Contours of the World Economy 1-2030 AD Knowledge and the Wealth of Nations A Farewell to Alms The Ascent of Money The Great Divergence Clash of Extremes War and Peace and War Historical Dynamics The Age of Lincoln The Great Upheaval What Hath God Wrought Freedom Just Around the Corner Throes of Democracy Grand New Party A Beautiful Math When Genius Failed Catholicism and Freedom American Judaism   Policies Terms of use © http://www.gnxp.com Razib's total feed: |
|||||||||||||||||||||||||||||||||||||||||||||||||||||||||||||||||||||||||||||||||||