The Thylacine, or the Tasmanian Tiger, is a tragic story that we all know (or should know!). Too late did humans realize how precious it was, a large(ish) marsupial carnivore endemic to Tasmania. Hunted to extinction, the last one died because it was not properly taken care of.
The Tasmanian Tiger is an example of why science is not just instrumental. That is, science is not simply the handmaid of engineering. Most people with an interest in biology have some instinctive reaction to the Tasmanian Tiger and what happened. There’s a natural pathos in it.
If you read The Monkey’s Voyage you know that the marsupials of South America probably derive from a single dispersal event. Genetics has determined that the South American Monito del monte is the most basal of the superorder Australidelphia, which includes all Australasian marsupials. That means instead of the single South American marsupial of this superorder being due to a migration from Australia, the Australian lineages diversified from a single South American ancestor. The Monito del monte is the last living descendent of this once extensive clade.
This means that all of the vareigated marsupials of Australia probably diversified during the Cenozoic, even though the divergence between marsupials and placental mammals dates deep into the Mesozoic. The Koala, the Kangaro, and the Tasmania Devil, all derive from the same source.
The Tasmanian tiger or thylacine (Thylacinus cynocephalus) was the largest carnivorous Australian marsupial to survive into the modern era. Despite last sharing a common ancestor with the eutherian canids ~160 million years ago, their phenotypic resemblance is considered the most striking example of convergent evolution in mammals. The last known thylacine died in captivity in 1936 and many aspects of the evolutionary history of this unique marsupial apex predator remain unknown. Here we have sequenced the genome of a preserved thylacine pouch young specimen to clarify the phylogenetic position of the thylacine within the carnivorous marsupials, reconstruct its historical demography and examine the genetic basis of its convergence with canids. Retroposon insertion patterns placed the thylacine as the basal lineage in Dasyuromorphia and suggest incomplete lineage sorting in early dasyuromorphs. Demographic analysis indicated a long-term decline in genetic diversity starting well before the arrival of humans in Australia. In spite of their extraordinary phenotypic convergence, comparative genomic analyses demonstrated that amino acid homoplasies between the thylacine and canids are largely consistent with neutral evolution. Furthermore, the genes and pathways targeted by positive selection differ markedly between these species. Together, these findings support models of adaptive convergence driven primarily by cis-regulatory evolution.
The authors are saying that the clear morphological convergences between Tasmania Tigers and canids, which are obvious to anyone with eyes, aren’t detectable in similar sequence identity in regions of the genome known to be functional relevant to the characteristics of interest. Instead of sequence identity they suggest that rather the morphology is being controlled by evoutionary genetic process of cis-regulatory adaptation.
In the Mike Lynch vs. Sean Carroll debate of about ten years back, they’re saying that Sean Carroll was right (see this Hoekstra & Coyne paper for a different take).
Part of the issue here is probably the sort of traits they’re focused on. There seems to be something about the gross morphological characteristics humans find salient that make them the target of cis-regulatory mediated evolutionary processes.
Finally, they suggest with a PSMC plot that Tasmanian Tiger populations crashed around 70,000 years ago, well before Australian Aboriginals arrived. First, I’m not sure that I trust the 70,000 number to be precise enough that we can say it doesn’t overalp with human arrival. But second, is it me, or does every PSMC look like the pot above? It’s probably some sort of publication bias, as you don’t put in PSMC figures if they don’t show a bottleneck. But I’m kind of getting tired of it.
Thinking back to The Turks in World History the author points out that even the most explicit Islamic of the late Turkic empires, that of the Ottomans, persisted with a customary law similar and cognate to the Mongol yasa. Perhaps then the folkway of the nomadic Turk was sublimated and integrated into the Islamic superstructure of the Ottoman ruling ideology?
I went to a work-related Christmas party thrown by my company’s law firm. There were a lot of VC guys there. Two of them confused me for a blockchain entrepreneur (one of them was asking about a conflict with the CFO). I think I better get into blockchain….
Second, I feel the image that goes along with the article is problematic as fuck. The woman pictured seems to be geared toward appealing to cishet male norms of “attractiveness.” On the other hand, if intersectional feminists typically look something like Josie Maran…well, I won’t go there.
I will observe also that I find out about a lot of far-right movements and individuals through Left and Centrist Twitter (the two groups are interested for different reasons).
Why the #MeToo Movement Should Be Ready for a Backlash. I don’t care too much about Al Franken, but digging a little deeper I think there might be some dirty tricks going on there…. I was rather dim on the prospects for Republicans in 2018, but at this rate, the Dems might “struggle-session” their way into defeat.
Until recently, Andrea Ramirez, 43, thought she was part Mexican.
But the results from an at-home genetic test from 23andMe revealed that she is a mix of Northern European, North African and a little Native American.
And not at all hispanic.
There can be no genetic test for being Hispanic because that is a socio-cultural identity. There are Korean, Arab, and Nordic Hispanics. Even the most common genetic profile varies, from mostly European Argentines to mostly indigenous Bolivians to Afro-Cubans and Afro-Colombians.
When I read stuff like this I really wonder what they teach journalists (the Census explicitly declaims the the idea that Hispanic is a racial category).
1) I’m not happy with the clusters that I used. I may change them (in which case I’ll rerun everything). 2) Once I’ve done that I’ll probably send some of my scripts to Zack Ajmal and he can run all the Harappa individuals with this new cluster.
Finally, people from the “Cow Belt” don’t get genotyped. No submissions from UP or Bihar so far. Very frustrating.
The word problematic is problematic in my opinion. I really want to punch people when they use that word. But I’ve lost that battle.
My friend Chad Niederhuth is starting his plant genomics lab at Michigan State. He’s looking for graduate students and postdocs.
My friend Nathan Pearson’s HLA genomics start-up, Root is out of stealth mode.
Looking at my Kindle stack wondering about which of these five books to tackle next:
Ray Kurzweil likes to talk about the fact that humans are bad at modeling exponential rates of growth. In this case, he’s talking about the rate of change in information technology. Whatever you think about Ray’s general ideas as outlined in books such as The Singularity Is Near, I think it’s a pretty good insight that needs reiteration.
More generally in social processes, I think humans living at any given time are not very cognizant of nonlinearities, and the sorts of exogenous shocks that might happen in their lifetimes. And why would we be? The evolutionary psychological model for why we’re bad at conceptualizing rapid change is that until recently not much changed for most people at most times.
That is, humans were animals which lived near the Malthusian limit at a stationary state. The rate of change did increase during the Holocene, but even with ancient Egypt consider how different the life of a peasant in the Old Kingdom was versus the New Kingdom. Over 2,000 years not much had changed. Even at the elite levels, not much had changed (in fact, the Egyptian religion maintained cultural continuity from ~3000 BC to ~500 AD, with the shutdown of the temple at Philae). Now consider the 2,000 years between ancient Rome and the modern West. Or, consider the 300 years between the Augustan Age and revival of the Empire under the Tetrarchy, and contrast that to the present year and 1717.
The modern world is strange because great changes in technology and social values can occur over and over across a single lifetime. Someone born in 1896 would mature and develop a world-view conditioned by the “long 19th century,” which lasted until 1914. Then they’d experience the “shock” of the “War to End All Wars.”
Arguably the period between the Congress of Vienna in 1815 and outbreak of World War I in Europe in 1914 was marked by evolution, rather than revolution, in social and political structures. 1848 did not prefigure a tumult equivalent to the French Revolution or the period of the Napoleonic Wars. Italy and Germany were unified ultimately under conservative nationalists. Darwinism, abolitionism, and women’s rights arguably were movements who were seeded during the Enlightenment and exhibited long pregnancies until the point that they erupted to prominence.
Between 1914 and 1920 a whole world fell away. The Empire of the Tsars collapsed, and was replaced by the chiliastic Bolshevik regime. Austria-Hungary and the Ottoman Empire were dismembered and their monarchies were overthrown, while Germany transformed from a conservative monarchy to a liberal republic.
My friend Walter Olson pointed me to this from John Locke:
To love truth for truth’s sake is the principal part of human perfection in this world, and the seed-plot of all other virtues.
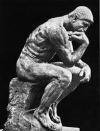
This is great and inspirational quote, but in most interpretive sieves I believe it is wrong. Hume’s assertion that “reason is and ought only to be the slave of the passions” is closer to the truth in terms of describing the typical human in terms of how they think, and what they value.
One of the insights of modern cognitive science is that the “rational” and “reflective” component of our mind tends to promote some delusions about its role in our decision-making process. Rather than being the conductor, it’s more often the rationalizer. That is, we make a decision, and then we concoct rationales after the fact. One can think of conscious rationality as a public relations outfit, as opposed to the client.
None of this is deep wisdom, and the latest research is all outlined in The Enigma of Reason. But, another issue which I think is important to note is that the propaganda over the generations by the very small proportion of the population for whom reason and truth are prioritized as the summum bonum of human existence, as implied by Locke’s assertion, have biased our understanding of history. The reason being that they are the ones disproportionately writing the history! Our species’ collective memory lies to us because cultural organs of memory have their own agendas (albeit, unconsciously!).
In Near Eastern antiquity the scribal caste was very much a group of literate wizards. No doubt some elements of literacy percolated to the general public, as is evident by graffito hieroglyphics by workers in ancient Egypt, but habitual engagement with the written word was the purview of a small group of professionals. These individuals dealt in abstraction in their day to day, and by the middle of the first millennium B.C. out of the culture of scribes developed the group we would term intellectuals. The philosophers, prophets, and sages of antiquity. A period when religion, magic, and science, were all one.
Of course, many of these intellectuals were not from the scribal caste as such. Many were aristocrats and gentry (e.g., Siddhartha and Plato). But by this time literacy had spread out beyond the scribal castes, and a civilian elite culture had emerged which valued intellectual pursuits in some fashion. Elite male leadership training in some societies began to include intellectual arts as part of their education. But we should be cautious about inferring from this that these elite males valued rhetoric and philosophy as ends in and of themselves. Rather, rhetoric and philosophy exhibited some instrumental (in politics for the former) and signaling value (abstruse philosophical abstraction could only be mastered by those with leisure and means, so it suggested one’s class origin and cultivation).
Across the centuries, and even millennia, the minority of intellectuals who notionally chased the truth, Plato, Sima Qian, and Ibn Khaldun, remain in our memories because their ideas were powerful, attractive, and their intellectual coherency and brilliance impressed future generations of thinkers. But we need not infer from this that in their own time they were of such inordinate fame or glory in relation to others of similar note though intellectual mediocrity. To give a concrete example, for a few shining decades phlogiston and Lysenkoism were bright and influential, even though the latter, and possibly the former, were both fraudulent enterprises.
Neighbor-joining tree of genetic distances between populations
In L. L. Cavalli-Sforza’s The History and Geography of Human Genes he used between population group genetic distances, as measured in FST values, to generate a series of visualizations, which then allowed him to infer historical processes. Basically the way it works is that you look at genetic variation, and see how much of it can be allocated to between groups. If none of it can be allocated to between groups, then in a population genetic sense it doesn’t make much sense to speak of distinctive groups, they’re basically one breeding population. The higher the FST statistic is, the more of the variation is partitioned between the groups.
Roughly this is used to correlate with genetic distance as well as evolutionary divergence. The longer two populations have been separated, the more and more genetic differences they’ll accumulate, inflating the FST value. There are a lot of subtleties that I’m eliding here (see Estimating and interpreting FST: the impact of rare variants for a survey of the recent literature on the topic and pathways forward), but for a long time, FST was the go-to statistic for making phylogenetic inferences on a within-species scale.
Today we have other techniques, Structure, Treemix, fineStructure, and various local ancestry packages.
But FST is still useful to give one a Gestalt sense of population genetic differences. Cavalli-Sforza admits in The History and Geography of Human Genes that European populations had very low pairwise FST, but because of the importance of Europe for sociocultural reasons a detailed analysis of the region was still provided in the text. Additionally, they had lots of European samples (non-European Caucasoids were thrown into one category for macro-group comparisons because there wasn’t that many samples).
Ancient populations were very distinct in Europe from modern ones.
Many modern groups are clustered close together.
The bulk of the population genetic structure in modern Europe seems to have been established in the period between 3000 BCE and 2000 BCE. This is not that much time for a lot of distinctiveness to develop, especially on the geographically open North European plain. I suspect with more and more Mesolithic and early to middle Neolithic DNA we’ll see that some of the modern population structure is a ghost of ancient substrate absorption.
Many of the ethno-national categories that are very significant in recent history, and impact the cultural memories of modern people and their genealogies, have very shallow roots. This does not mean they are not “real” (I don’t know what that’s supposed to mean at all), just that many of the identities which seem so salient to us today may be relatively recent in terms of their significance to large groups of humans….
One reason I quite like Norman Davies’ book The Isles is that it is a history of Britain and Ireland which explicitly aims to not privilege the story of the English inordinately. As the most powerful and numerous people of the British Isles the English loom large, but in the period between Gildas and Bede things were very different. In the early 600s the Welsh king Cadwallon ap Cadfan conquered and held Northumbria for a period, northern England from the Irish Sea to the North Sea. But this was the last time that a Celtic monarch held land in eastern England, unless you count the Tudors.
In The Isles, written at the turn of the century, Davies promotes the view dominant among historians at that time that the transition from British Celtic to Anglo-Saxon occurred through diffusion of elite culture. He alludes to the fact that in the year 700 the law code of Wessex alludes explicitly to the fact the weregild paid for the death of a Saxon was many-fold greater than that paid for a Briton (of the same class status). This suggests that many Britons were still resident in the Anglo-Saxon kingdoms. The contrasting view, which was dominant in the early 20th century, was that the English replaced the Celts in toto. The Irish, Welsh, and to some extent the Scots, were viewed as racially distinct from the Germanic English.
2015’s The fine scale genetic structure of the British population answered many of these questions. It turns out the maximal positions were incorrect. The authors estimate that 10-40% of the ancestry in eastern and southern England (the red positions on the map) derive from Germanic peoples which we might term Saxon, Angles, and Jutes. Even if the fraction is as low as 10% that is not trivial. If we take a value closer to ~25%, unless there were massive reproductive advantages for elites, it could not have just been diffusion from the elite. Archaeologists also see wholesale changes in agricultural patterns in eastern England, indicative of a transfer of a whole folkway.
All that being said it is likely that the majority of the ancestry of the population of England proper descends from Britons. In fact, once the Anglo-Saxon cultural hegemony was established it seems that some elite Britons may also have changed their identity. It is always a curious fact that the names of the first kings in the genealogy of the House of Wessex are distinctively Celtic. Just as Romano-Gallic aristocrats began aping the styles and mores of the Frankish elite in the 6th century, so perhaps some British warlords became Saxons.
Using similar methods many of the same authors have now put out a preprint on Ireland, Insular Celtic population structure and genomic footprints of migration. Unlike the earlier work on Britain, they’ve acknowledged the ancient DNA results which have reshaped our understanding of population turnover in Ireland. That being said, they are focused on more recent events, as well as spatial structure in the modern era.
Though they don’t have access to as detailed a regional data set as in the earlier work on Britain, in this case, the authors managed to detect a lot of regional population structure within Ireland. Why? Though the Irish are relatively homogeneous, as all Northern Europeans are, looking at long tracts of the genome and the patterns therein can squeeze out more information.
The figure at the top of this post shows how well they can cluster individuals geographically: they’ve basically recapitulated the “map of the British Isles.” There aren’t too many surprises. Western Ireland seems to exhibit greater genetic differences as a function of distance. Probably because it’s less developed, and perhaps because it has been less impacted by outsiders. Ulster and southern Scotland are strongly connected genetically. There are two issues going on here. First, the famous migration of Protestants into this region of Ireland from Scotland and northern England that occurred after the conquest of the 16th century. And second, the earlier migration of Irish to Scotland, which resulted in the creation of the Dal Riata kingdom.
Additionally, the authors detect more admixture in several parts of Ireland from Norse than they had anticipated. The mixing of Scandinavians and Irish created a hybrid culture, the Norse-Gaels, which was highly influential around the Irish Sea. So it would not be exactly surprising if there was a greater Scandinavian contribution to Irish ancestry than had been anticipated.
Of greater interest to me is the impact of social-political institutions on the genetic structure or lack thereof. Both Britain and Ireland have homogenized modal clusters. In Britain, this is associated with the expanding cultural zone of Anglo-Saxon rule, and later became the core of England. In Ireland, it seems to be the Pale, where Anglo-Norman rule was dominant for many centuries. Rapid cultural change seems to induce a state of panmixia. Genetic distinctiveness in the British Isles seems to have persisted in populations which were geographically isolated, or politically insulated, from expansive, assimilative, and integrative cultures. The modal cluster in Ireland is far smaller than in England, which nicely correlates with the much more limited impact of the Anglo-Norman ascendency of the medieval period.
The results to the left are from 23andMe for someone whose paternal grandparents were immigrants from southern Germany. Their mother had a father who was of English American background (his father was a Yankee American with an English surname and his mother was an immigrant from England), and grandparents who were German (Rhinelander) and French Canadian respectively on their maternal side.
Looking at the results from 23andMe one has to wonder, why is this individual only a bit under 25% French & German, when genealogical records show places of birth that indicates they should be 75% French & German (more precisely, 62.5% German and 12.5% French). Though their ancestry is 25% English, only 13% of their ancestry is listed as such.
First, notice that nearly half of their ancestry is “Broadly Northwestern European.” Last I checked 23andMe uses phased haplotypes to detect segments of ancestry. This is a very powerful method and is often quite good at zeroing in on people of European ancestry. But with Americans of predominant, but mixed, Northern European background rather than giving back precise proportions often you obtain results of the form of “Broadly…” because presumably, recombination has generated novel haplotypes in white Americans.
But this isn’t the whole story. Why, for example, are many of the Finnish people I know on 23andMe assigned as >90% Finnish, while a Danish friend is 40% Scandinavian?
The issue here is that to be “Finnish” and “Scandinavian” are not equivalent units in terms of population genetics. Finns are a relatively homogeneous ethnic group who seem to have undergone a recent population bottleneck. In contrast, Scandinavia encompasses several different, albeit related, ethnicities which are geographically widely distributed.
Ethnic identities are socially and historically constructed. Additionally, they are often clear and distinct. This is not always the case for population genetic classifications. On a continental scale, racial classification is trivial, and feasible with only a modest number of genetic markers. Why? Because the demographic and evolutionary history of Melanesians and West Africans, to give two concrete examples, are distinct over tens of thousands of years. Population genetic analyses which attempt to identify or differentiate these groups have a lot of raw material to work with.
If I reflect on my nearer extended family one curious aspect is that we seem to have a habit of moving a fair amount. My immediately family immigrated to the United States from Bangladesh. But we’ve relocated a few times since we moved to this country, going from one coast to another. But this pattern is older and deeper. My maternal grandfather was a physician who moved rather frequently during my mother’s youth, while both my parents settled in Dhaka, the capital, though they were from the region to the south and east of that city. I have relatives in England, while a second cousin married and had a family in Venezuela, before eventually settling down in Sweden. Other relatives near and more distant have had sojourns in the Middle East, Japan, Brunei, Malaysia, and Australia.
Of course, this isn’t entirely surprising, as around ~4 percent of the population of Bangladesh lives abroad. But even in this country, we keep moving. My mother laments sometimes that her children seem to settle in distant parts of the country from her, but she has to remind herself that she was across several oceans when her parents died.
So I take great anthropological interest in articles such as this in The New Yorker, Where the Small-Town American Dream Lives On. In the piece, the author sketches out the peculiarities of a small town in western Iowa, Orange City, where people live around those whom they grew up with. Almost as if they develop the intimacies we associate with hunter-gatherer life.
Settled by Dutch immigrants more than 100 years ago, Orange City, Iowa, retains its peculiar ethnic character to this day. It is overwhelmingly white and dominated by Reformed Protestantism. But this isn’t the story of just one town. This piece is really outlining a microcosm of the sort of thing that happens on a larger scale in southwest Michigan, in towns like Holland. This area is also Dutch American in character, and somehow manages to retain economic vitality in an American landscape defined by the dynamism of a few large metropolitan conglomerations.
If you read Peter Turchin’s work you will note that what Dutch America has is asabiyyah. Social solidarity.
Part of this is likely the broad homogeneity of these regions. The sort of social capital eroded by the forces of diversity that Robert Putnam observed in Bowling Alone: The Collapse and Revival of American Community. But that can’t be the only part of the story. Much of Appalachia exhibits the same ethno-racial homogeneity of Dutch America, but it’s social statistics are not nearly as positive.
To understand what’s going on one needs to read books such as Albion’s Seed, American Nations or The Cousins’ Wars. These works outline that there are deep and lasting cultural differences among groups of white American Protestants who do not seem “ethnic” in any way moderns understand it. After the Civil War and up to the 1950s white Americans cultivated an ideology of cohesion which smoothed over differences which led to the fractures that broke out in the decades which culminated in the Age of Sectionalism. Central to this self-conception was the normative identity of white Protestants, whom both Jews and Catholics emulated explicitly and implicitly, respectively.
And yet differences persisted underneath the surface. From the piece:
The sociologists Patrick Carr and Maria Kefalas spent several months in a small Iowa town and found that children who appeared likely to succeed were from an early age groomed for departure by their parents and teachers. Other kids, marked as stayers, were often ignored in school. Everyone realized that encouraging the ambitious kids to leave was killing the town, but the ambition of the children was valued more than the life of the community. The kids most likely to make it big weren’t just permitted to leave—they were pushed.
In Orange City, that kind of pushing was uncommon. People didn’t seem to care about careers as much as they did in other places….
The ACS reports that the largest ancestry components among Iowans were German (35.9%), Irish (13.7%), English (8.5%), American (6.2%), and Norwegian (5.2%). Genetically there is almost no difference between these Northern European groups (they all diverged over the last 4,500 years). But culturally there are differences. “American,” and to a lesser extent Irish and English, ancestry may correlate with migration from the South and the Border States. In contrast, English ancestry was at least in part derived from Yankee settlers from New England. These were very different cultures. Europeans from Scandinavia and Germany tended to align culturally more with the Yankees (with the major exception of alcohol, which set apart the newcomers from the old stock, who had an ambivalent relationship with drink).
In Not by Genes Alone: How Culture Transformed Human Evolution the authors report that in Illinois farmers of British descent behaved differently than those of German descent even after 150 years. Germans tended to pass farms down through the family, forgoing profits in cases where they could sell. In contrast farming families of British ancestry tended to behave more like the rational actors predicted by the theory of the firm. They did not make as many sacrifices to keep farms in the family.
These differences among white Protestants are still clear in the General Social Survey. Limiting to self-identified white non-Hispanic Protestants surveyed after the year 2000, below you can see the highest degree attainments by ethnic identification:
Highest degree attainment of white Protestant Americans, year 2000 and after
Less than HS
HS
Associates
Bachelors
Graduate
Britain
8
47
9
23
14
Nordic
7
46
9
25
13
Dutch
11
61
5
20
4
Irish
11
57
8
16
8
German
9
55
8
19
9
Scottish
4
54
9
23
10
American
23
63
6
4
5
The white Protestants who identify as “American” tend to be concentrated in the border states and in the South. They are not as educated as other white Americans. They are a plural majority in much of Appalachia and are also likely dominant among white populations in areas of the South where the black proportion is higher. These “Americans” are of broadly British and Irish origin, but their residence in this country has been long enough that they no longer identify with Europe in any way.
If you read some history or plumb the depths of social science the uniqueness of Orange City, Iowa, is entirely unsurprising. The “secret” of Orange City is the same secret that the German towns of Wisconsin and the Dutch towns of southwest Michigan exhibit, and that is a cultural folkway passed down through the generations which allows for cohesion and collective action in a world of increasing anomie. The culture of the back-country white settlers in Appalachia, in contrast, was defined from its inception by a certain form of libertarian anomie.
Curiously The New Yorker piece highlights a similarity in social structure between Appalachia and modern urban life: “In Philadelphia, she’d had her close friends, and everyone else was more or less a stranger; in Orange City, there was a large middle category as well. ” Though I am not denigrating communal collective action in Appalachia, it is also true that that region has been characterized by a form of familialism. Though Appalachian whites were enthusiastic Christians, their religion was often individualistic. Their elites hewed to an ordered Presbyterianism, but the masses were pietistic Methodists or Baptists. It was an atomized society.
Modern cosmopolitan urban life is also characterized by the chasm between the stranger and the close friend or kin. To make life tolerable one must rely on the impartiality and efficiency of institutions, which can reduce the transaction costs between strangers, and force trust externally.
What will happen if and when institutions collapse? I do not believe much of America has the social capital of Orange City, Iowa. We have become rational actors, utility optimizers. To some extent, bureaucratic corporate life demands us to behave in this manner. Individual attainment and achievement are lionized, while sacrifice in the public good is the lot of the exceptional saint.
But we will have to rediscover trust in something beyond the bureaucracy and the family, or the swell of barbarism will probably consume us.
The local Dollar General store, built on a rural highway and surrounded by farmland, sells no fresh meat, greens or fruit. Yet the 7,400-square-foot steel-sided store has most of what Eddie Watson needs.
…
Dollar General Corp.’s 14,000 stores yielded more than double the profit of Macy’s Inc. on less revenue during its most recent fiscal year. And its $22 billion market value eclipses the largest U.S. grocery chain, Kroger Co., which has five times the revenue.
…
The more the rural U.S. struggles, company officials said, the more places Dollar General has found to prosper. “The economy is continuing to create more of our core customer,” Chief Executive Todd Vasos said in an interview at the company’s Goodlettsville, Tenn., headquarters.
…
Dollar General’s typical shopper “doesn’t look at her pantry or her refrigerator and say, ‘You know, I’m going to be out of ketchup in the next few days. I’m going to order a few bottles,’” said Mr. Vasos, the company’s chief executive. “The core customer uses the last bit of ketchup at the table the night prior, and either on her way to work or on her way home picks up one bottle.”
Camouflage is a proven winner. This year, Dollar General became the exclusive seller of dog food from the camouflage-gear brand Mossy Oak. “Even off-brand camo does well here,” said the Evensville store manager Justin Ray, who has a display of camouflage merchandise, including pacifiers and pet toys.
As someone who is part of the personal genomics sector, I keep track of media representations of the industry very closely. There is the good and the bad, some justified and some not.
But there is one aspect which I need to weigh in on because it is close to my interests and professional focus, and it is one where I have a lot of experience: ancestry inference on human data.
Periodically I see in my Twitter timeline an article shared by a biologist which is filled with either misrepresentation, confusions, and even falsehoods. Of course, some of the criticisms are correct. The problem is that when you mix truth and falsehood or sober analysis and critique with sensationalism the whole product is debased.
I’m going to address some of the most basic errors and misimpressions. This post is “part 1” because I might have follow-ups, as I feel like this is a situation where I have to put out fires periodically, as people write about things they don’t know about, and then those articles get widely shared to a credulous public.
First, if an article mentions STRs or microsatellites or a test with fewer than 1,000 markers in a direct to consumer genomic context, ignore the article. This is like an piece where the author dismisses air travel because it’s noisy due to propeller-driven planes. Propeller-driven planes are a very small niche. Similarly, the major direct to consumer firms which have sold close to ~10 million kits do not use STRs or microsatellites, very much a technology for the 1990s and 2000s. Any mention of STRs or microsatellites or low-density analyses indicate the journalist didn’t do their homework, or simply don’t care to be accurate.
Second, there is constant harping on the fact that different companies give different results. This is because tests don’t really give results as much is interpretations. The raw results consist of your genotype. On the major SNP-chip platforms this will be a file on the order of 20 MBs. The companies could provide this as the product, but most humans have difficulty grokking over 100,000 variables.
So what’s the solution? The same that scientists have been using for decades: reduce the variation into a much smaller set of elements which are human digestible, often through tables or visualization.
For example, consider a raw data set consisting of my three genotypes from 23andMe, Ancestry, and Family Tree DNA. Merged with public data these are ~201,000 single nucleotide markers. You can download the plink formatted data yourself and look at it. The PCA below shows where my three genotypes are positioned, by the Tamil South Asians. Observe that my genotypes are basically at the same point:
The differences between the different companies have nothing to do with the raw data, because with hundreds of thousands of markers they capture enough of the relevant between population differences in my genome (do you need to flip a coin 1 million times after you’ve flipped it 100,000 times to get a sense of whether it is fair?). The law of large numbers is kicking in at this point, with genotyping errors on the order of 0.5% not being sufficient to differentiate the files.
Sure enough raw genotype files of the three services match pretty closely. 99.99% for Family Tree DNA and 23andMe, 99.7% for Family Tree DNA and Ancestry, and 99.6% for Ancestry and 23andMe. For whatever reason Ancestry is the outlier here. My personal experience looking at genotype data from Illumina chips is that most are pretty high quality, but it’s not shocking to see instances with 0.5% no call or bad call rates. For phylogenetic purposes if the errors are not systematic it’s not a big deal.
The identity to other populations is consistent. About 74% to Tamils. 72-73% for other Eurasians. 71% for the Surui, an isolated Amazonian group. And 69% to Yoruba. Observe that this recapitulates the phylogenetic history of what we know for the population which I am from, Bengalis. The greater the genetic distance between two populations due to distinct evolutionary histories the greater the genetic divergence. This is not rocket science. This gets to the point that the raw results make a lot more sense when you integrate and synthesize them with other information you have. Most customers are not going into the process of getting a personal genomic ancestry test blind…but that causes pitfalls as well as opportunities.
But most people do not receive statistics of the form:
SNP Identity
You
Yoruba
0.69
You
German
0.72
You
Japanese
0.73
You
Tamil
0.74
Mind you, this is informative. It’s basically saying I am most genetically distant from Yoruba and closer in sequence to Tamils. But this is somewhat thin gruel for most people. Consider the below which is a zoom in of PC 2 vs. PC 4. I am blue and the purple/pink are Tamils, and the population at the bottom left are East Asians.
If you looked at enough PCA plots it will become rather clear I am shifted toward East Asians in comparison to most other South Asians. The high identity that I have with Japanese and Dai is due in part to the fact that I have relatively recent admixture from an East Asian population, above and beyond what is typical in South Asians. Remember, all three of my genotypes are basically on the same spot on PCA plots. That’s because they’re basically the same. Genotyping error is rather low.
How do we summarize this sort of information for a regular person? The standard method today is giving people a set of proportions with specific population labels. Why? People seem to understand population labels and proportions, but can be confused by PCA plots. Additionally, the methods that give out populations and proportions are often better at capturing pulse admixture events relatively recent in time than PCA, and for most consumers of ancestry services, this is an area that they are particularly focused on (i.e., Americans).
An easy way to make one’s genetic variation comprehensible to the general public is to model them as a mixture of various populations that they already know of. So consider the ones above in the plink file. I ran ADMIXTURE in supervised model progressively removing populations for my three genotypes. The results are below.
Dai
Druze
German
Japanese
Papuan
Sardinian
Surui
Tamil
Yoruba
Razib23andMe
11%
3%
8%
4%
1%
0%
1%
73%
1%
RazibAncestry
10%
2%
8%
4%
1%
0%
1%
73%
1%
RazibFTDNA
11%
2%
8%
3%
1%
0%
1%
72%
1%
Dai
Druze
German
Japanese
Papuan
Sardinian
Surui
Tamil
Razib23andMe
11%
3%
8%
4%
1%
0%
1%
73%
RazibAncestry
10%
3%
8%
4%
1%
0%
1%
74%
RazibFTDNA
11%
3%
8%
3%
1%
0%
1%
73%
Dai
Druze
Japanese
Papuan
Surui
Tamil
Razib23andMe
10%
9%
4%
1%
1%
74%
RazibAncestry
10%
9%
4%
1%
1%
75%
RazibFTDNA
11%
9%
4%
1%
1%
74%
Dai
Japanese
Surui
Tamil
Razib23andMe
11%
4%
1%
84%
RazibAncestry
10%
4%
1%
85%
RazibFTDNA
11%
3%
1%
84%
Please observe again that they are broadly congruent. These methods exhibit a stochastic element, so there is some noise baked into the cake, but with 200,000+ markers and a robust number of reference populations the results come out the same across all methods (also, 23andMe and Family Tree DNA seem to correlate a bit more, which makes sense since these two genotypes are more similar to each other than they are to Ancestry).
Observe that until I remove all other West Eurasian populations the Tamil fraction in my putative ancestry is rather consistent. Why? Because my ancestry is mostly Tamil-like, but social and historical evidence would point to the likelihood of some exogenous Indo-Aryan component. Additionally, seeing as how very little of my ancestry could be modeled as West African removing that population had almost no impact.
When there were three West Eurasian populations, Germans, Druze, and Sardinians, the rank order was in that sequence. Removing Germans and Sardinians and the Druze picked up most of that ancestral component. This a supervised method, so I’m assigning the empirical populations as reified clusters which can be used to reconstitute the variation you see in my own genotype. No matter what I put into the reference data, the method tries its best to assign proportions to populations.
The question then comes into the stage of subtle choices one makes to obtain the most informative inferences for the customer. These are not always matters of different results in terms of accuracy or precision, but often of presentation. If West Eurasian populations are removed entirely, my Tamil fraction inflates. That’s the closest to the West Eurasian populations left in the data. In contrast, the East Asian fraction remains the same because I’ve left the two proxy populations in the data (I rigged the die here because I know I have Tibeto-Burman admixture which is a combination of Northeast and Southeast Asian).
Let’s do something different. I’m going to swap out the West Eurasian populations with equivalents.
Armenians
Dai
French_Basque
Japanese
Mandenka
Surui
Sweden
Tamil
Razib23andMe
6%
11%
0%
4%
1%
1%
5%
72%
RazibAncestry
5%
11%
0%
4%
1%
1%
5%
73%
RazibFTDNA
6%
11%
0%
4%
1%
1%
5%
72%
German
Papuan
Yoruba
Razib23andMe
68%
20%
13%
RazibAncestry
68%
20%
13%
RazibFTDNA
68%
20%
13%
French_Basque
Tamil
Razib23andMe
8%
92%
RazibAncestry
7%
93%
RazibFTDNA
8%
92%
Tamil
Yoruba
Razib23andMe
97%
3%
RazibAncestry
97%
3%
RazibFTDNA
97%
3%
I have no ancestry from French Basque, but I do have ancestry from Armenians and Swedes in this model. Why? If you keep track of the most recent population genomic ancestry this all makes sense. But if you don’t, well, it’s harder to unpack. This is part of the problem with these sorts of tests: how to make it comprehensible to the public while maintaining fidelity to the latest research.
This is not always easy, and differences between companies in terms of interpretation are not invidious as some of the press reports would have you think, but a matter of difficult choices and trade-offs one needs to make to give value to customers. True, this could all be ironed out if there was a ministry of genetic interpretation and a rectification of names in relation to population clusters, but right now there isn’t. This allows for both brand differentiation and engenders confusion.
In most of the models with a good number of populations, my Tamil ancestry is in the low 70s. Notice then that some of these results are relatively robust to the populations one specifies. Some of the patterns are so striking and clear that one would have to work really hard to iron them out and mask them in interpretation. But what happens when I remove Tamils and include populations I’m only distantly related to? This is a ridiculous model, but the algorithm tries its best. My affinity is greatest to Germans, both because of shared ancestry, and in the case of Papuans, their relatively high drift from other East Eurasians and Denisovan ancestry. But both Papuan and Yoruba ancestry are assigned because I’m clearly not 100% German, and I share alleles with both these populations. In models where there are not enough populations to “soak up” an individual’s variation, but you include Africans, it is not uncommon for African ancestry to show up at low fractions. If you take Europeans, Africans, and East Asians, and force two populations out of this mix, then Europeans are invariably modeled as a mix of Africans and East Asians, with greater affinity to the latter.
Even when you model my ancestry as Tamil or Yoruba, you see that there is a Yoruba residual. I have too much genetic variation that comes from groups not closely related to the variation you find in Tamils to eliminate this residual.
Just adding a few populations fixes this problem:
Dai
Tamil
Yoruba
Razib23andMe
14%
83%
2%
RazibAncestry
14%
84%
2%
RazibFTDNA
14%
83%
2%
Dai
German
Tamil
Yoruba
Razib23andMe
15%
10%
74%
1%
RazibAncestry
14%
9%
75%
1%
RazibFTDNA
15%
10%
74%
1%
Notice how my Tamil fraction is almost the same as when I had included in many more reference populations. Why? My ancestral history is complex, like most humans, but it’s not that complex. The goal for public comprehensibility is to reduce the complexity into digestible units which give insight.
Of course, I could just say read Inference of Population Structure Using Multilocus Genotype Data. The basic framework was laid out in that paper 17 years ago for model-based clustering of the sort that is very common in direct to consumer services (some use machine learning and do local ancestry decomposition across the chromosome, but really the frameworks are an extension of the original logic). But that’s not feasible for most people, including journalists.
Consider this piece at Gizmodo, Why a DNA Test Is Actually a Really Bad Gift. I pretty much disagree with a lot of the privacy concerns, seeing as how I’ve had my public genotype downloadable for seven years. But this portion jumped out at me: “Ancestry tests are based on sound science, but variables in data sets and algorithms mean results are probabilities, not facts, as many people expect.”
Yes, there are probabilities involved. But if a DNA test using the number of markers above tells you you are 20% Sub-Saharan African and 80% European in ancestry, that probability is of the same sort of confidence of you determining that a coin flip is fair after 100,000 flips. True, you can’t be totally sure after 100,000 flips that you have a fair coin, but you can be pretty confident. With hundreds of thousands of markers, a quantum of 20% Sub-Saharan African in a person of predominantly European heritage is an inference made with a degree of confidence that verges upon certitude within a percentage or so.
As for the idea that they are not “facts.” I don’t even know what that means in this context. And I doubt the journalist does either. Which is one of my main gripes with these sorts of stories: unless they talk to a small subset of scientists the journalists just don’t know what they are talking about when it comes to the statistical genetics.
Finally, there is the issue about what does it even mean to be % percent of population X, Y, or Z? Even many biologists routinely reify and confuse the population clusters with something real and concrete in a Platonic sense. But deep down when you think about it we all need to recall we’re collapsing genealogies of many different segments of DNA into broad coarse summaries when we say “population.” And populations themselves are by their nature often somewhat open and subject to blending and flow with others. A population genomic understanding of structure does not bring into clarity Platonic facts, but it gives one instruments and tools to smoke out historical insight.
The truth, in this case, is not a thing in and of itself, but a dynamic which refines our intuitions of a fundamentally alien process of Mendelian assortment and segregation.

 The Thylacine, or the Tasmanian Tiger, is a tragic story that we all know (or should know!). Too late did humans realize how precious it was, a large(ish) marsupial carnivore endemic to Tasmania. Hunted to extinction, the last one died because it was not properly taken care of.
 This means that all of the vareigated marsupials of Australia probably diversified during the Cenozoic, even though the divergence between marsupials and placental mammals dates deep into the Mesozoic. The Koala, the Kangaro, and the Tasmania Devil, all derive from the same source.
 The authors are saying that the clear morphological convergences between Tasmania Tigers and canids, which are obvious to anyone with eyes, aren’t detectable in similar sequence identity in regions of the genome known to be functional relevant to the characteristics of interest. Instead of sequence identity they suggest that rather the morphology is being controlled by evoutionary genetic process of cis-regulatory adaptation.


 Ray Kurzweil likes to talk about the fact that humans are bad at modeling exponential rates of growth. In this case, he’s talking about the rate of change in information technology. Whatever you think about Ray’s general ideas as outlined in books such as

 My friend


 The white Protestants who identify as “American” tend to be concentrated in the border states and in the South. They are not as educated as other white Americans. They are a plural majority in much of Appalachia and are also likely dominant among white populations in areas of the South where the black proportion is higher. These “Americans” are of broadly British and Irish origin, but their residence in this country has been long enough that they no longer identify with Europe in any way.


