In
the post from a few days ago showing areas where Non-Hispanic white proportions over & under predicted the % for Obama there were some interesting comments. One of the issues is that lumping different regions together obscures some information. Some readers wondered about regional differences, and I did too. So I thought it might be interesting to look at the South as distinct from the non-South. For the purposes of this post the "South" means: Virginia, West Virginia, North & South Carolina, Georgia, Tennessee, Alabama, Mississippi, Louisiana, Texas, Oklahoma, Kentucky and Arkansas. I excluded Maryland, Delaware and Missouri because I don't think these can be considered culturally Southern, especially the first two. In any case, first, scatterplots and loess best fit lines for the South & the non-South. The South is red/black, the non-South is blue/green.

For me the interesting point is that the "upturn" where the % for Obama increases is notable in the South, but not the non-South. That surprised me. What counties are these? Click for the larger image.
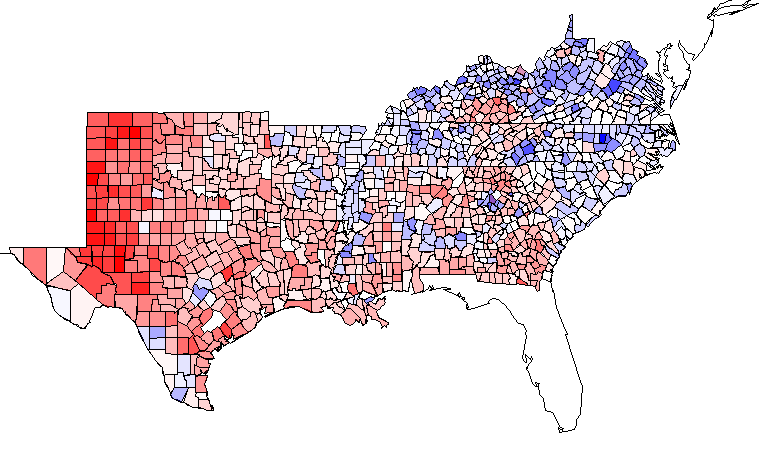
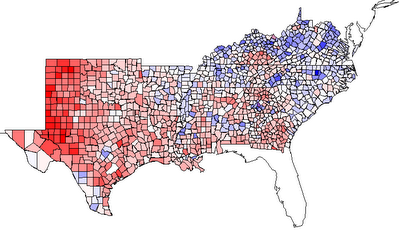
Some of the counties are not surprising in terms of being above the trendline, such as the "Research Triangle" region of North Carolina. But Elliott County, Kentucky? Who knew that this was the second-whitest county in the country to vote for Barack Obama. A map illustrating the trendline might be interesting. Blue is above the trendline, red below the trendline. I limited the data to the South here. Click for the larger image.
Labels: data, Election 2008