|
Leave print-view
Monday, October 09, 2006
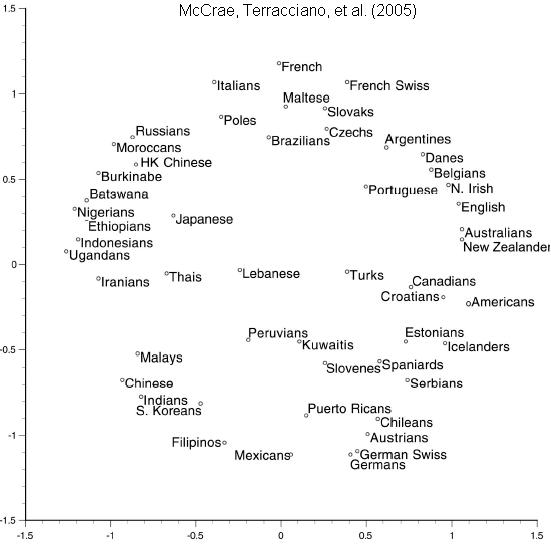
Part 1 of my crash-course on personality went over the psychometric and neurophysiological basics (to the extent these are currently understood). Part 3 will look more at the search for candidate genes that influence personality traits, as well as their importance in recent human evolution. This Part will be brief, focusing just on global variation in personality phenotypes. So far there are three largish datasets on the mean level of various personality traits across cultures: Lynn & Martin (1995), which synthesized a host of studies that used the Eysenck Personality Questionnaire; and Allik & McCrae (2004) and McCrae, Terracciano, et al. (2005), which used the Big Five's NEO-PI questionnaire. I'm going to focus on the first collection of data since they were collected from a variety of individuals within a given culture and have large Ns (roughly in the upper hundreds or over 1000 for each country), whereas the latter two were restricted to college students and for some cultures have smaller Ns (roughly in the lower-to-mid-hundreds). Here is a graph plotting different countries by their mean level of Extraversion and Neuroticism (units aren't important, basically how many questions you answer in favor of E or N), with the yellow axes representing the unweighted global medians:  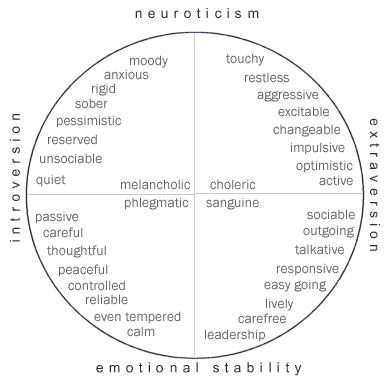 [See Note 1 for explanation of why Israel is red.] I tried to make it as legible as possible, and the abbreviations are clear (so "Rom" means Romanian, not the Roma). The accompanying graphic that I dug up online shows the Four Temperaments, which are essentially what the four quadrants of an E x N coordinate plane represent, along with some related characteristics. The list of natural language words that describe personality traits can be factor-analyzed, and this approach yields the same Big Five traits from the NEO-PI (Saucier & Goldberg 2001). A word like "excitable" would load positively on both the E and N factors, for instance. Note also that "anxious" reflects both low E and high N -- most interesting personality phenotypes will be composites like this. However, remember that the EPQ and NEO-PI measure continuously varying traits (the score conveys both direction and magnitude), unlike the typological approach of the Four Temperaments and the psychiatric manual DSM-IV. [See Note 1 for explanation of why Israel is red.] I tried to make it as legible as possible, and the abbreviations are clear (so "Rom" means Romanian, not the Roma). The accompanying graphic that I dug up online shows the Four Temperaments, which are essentially what the four quadrants of an E x N coordinate plane represent, along with some related characteristics. The list of natural language words that describe personality traits can be factor-analyzed, and this approach yields the same Big Five traits from the NEO-PI (Saucier & Goldberg 2001). A word like "excitable" would load positively on both the E and N factors, for instance. Note also that "anxious" reflects both low E and high N -- most interesting personality phenotypes will be composites like this. However, remember that the EPQ and NEO-PI measure continuously varying traits (the score conveys both direction and magnitude), unlike the typological approach of the Four Temperaments and the psychiatric manual DSM-IV.
Other characteristics don't relate much to E or N -- "dependable" or "orderly" are more related to the Big Five factor Conscientiousness. Recall that the EPQ measures a trait called Psychoticism, which is like the interaction between Big Five Agreeableness and Conscientiouness, but inversely related to them -- that is, someone who scores high on Psychoticism would score low on A and C. This multiplicative interaction will skew the distribution much more so than if just A or C or an additive interaction were chosen, and sure enough, in the chart below, notice that the scores on Psychoticism are much lower across countries than on E or N -- the highest score is 9.1, which is barely at the minimum score on either E or N, indicating that the bulk of the Psychoticism distribution is packed into the low end. And unfortunately, you can't decompose a product into a unique pair of multiplicands, so if one person's (or country's) Psychoticism score is higher than another's, that could be because of higher A and equal C, vice versa, or higher scores on both. Having said that, here is the list of Psychoticism scores, in descending order, from the studies synthesized by Lynn & Martin:
Czechoslovakia 9.1
India 8.1
Yugoslavia 7.4
Hong Kong 7
Australia 6.9
China 6.7
Germany 6.1
Uganda 6
France 5.5
Greece 5.4
Iran 5
Lithuania 5
Japan 4.8
Finland 4.7
Mexico 4.5
Egypt 4.4
Italy 4.4
Puerto Rico 4.4
Singapore 4.3
Bangladesh 4.2
Canada 4.2
Sri Lanka 4.2
Bulgaria 4.1
Brazil 4
Korea 4
Hungary 3.8
United Kingdom 3.8
Nigeria 3.6
Russia 3.6
Iceland 3.5
Israel 3.5
Romania 3.5
United States 3.3
Spain 3
Netherlands 2.8
Portugal 2.6
Norway 2.2
Now, Hong Kong would not be a financial giant if the average citizen scored very low on Conscientiousness; that is, if they were not driven to achieve, had little sense of order / structure, were not reliable / dependable, etc. So their high score here likely reflects having very low Agreeableness: distrust of others, more antagonistic, less empathy, etc. -- more competitive, in other words. I know nothing about Czech people, so I have no idea whether their scoring highest is due to very low A but average C, very low C but average A, or very low on both. Those who are thinking of the influence of having lived under Communism -- good guess, but political systems don't seem to shape personality (at least, not that quickly...). When the Berlin Wall fell, East Germans and West Germans were virtually indistinguishable by personality trait measures, though their political and social attitudes differed (see Note 2). So again, try not to read too much into the above list as far as A and C go, unless you know the population well enough to tell that their score reflects A more than C, or whatever.
There are two other large surveys of national levels of personality traits, but as mentioned, the Ns for each country are lower, and they mostly reflect on college students. Now, restriction of range effects for personality won't be as awful as with intelligence, but still, college students may not be entirely representative of their populations. I imagine this would be especially apparent in cultures where college students do nothing but extensive rote memorization, don't have time for social lives, and are expected to accept their teachers' views rather than question and challenge them. Presumably, generalizing from such a sample would make the population appear more introverted than it truly is (as in Nigeria or India, for example). With this warning in place, here are the visuals from each Big Five study:


Some differences in the format compared to before: the scores are T-scores, and the plots are the result of multidimensional scaling, which tries to crunch the variation across the separate Big Five traits into variation among fewer dimensions. In both graphs, the vertical axis is maximally aligned with N and the horizontal with E, though they are not strictly E and N as before since other traits have been crunched in. In the first graph, a positive value on the horizontal also represents higher O and lower A, while a positive value on the vertical also represents lower C and lower A. In the second graph, a high value on the vertical also represents lower C and lower A, but now a high value on the horizontal also represents higher A (unlike before), though it still also represents higher O. Again, though mostly intact, this flip-flopping is likely due to smaller and less representative samples than in the Eysenckian studies discussed at the beginning.
There's clearly much more to say, but I'll leave it at that for now. The next Part will try to tie the first two Parts together by looking at genes and evolution.
Note 1: I don't question Israel's high score on E, but it's low score on N would make it the most emotionally stable population on the planet by a longshot. While there may be some differences between American and Israeli Jews (most of whom are Ashkenazim in both countries), there is no way the data point can be accurate. It is likely a typo (this is a Lynn article, after all, so a typo wouldn't be unusual). In reality, their N score is probably above the global median, though by how much, who knows? I left the point as stated in Lynn's article, but it is likely somewhere above the data point for India, in the upper-right quadrant.
Note 2: Quoth Hofstede & McCrae (2004):
Angleitner and Ostendorf (2000) provided some provocative evidence [...]. They compared mean levels of NEO-PI-R scores from former East and West Germans. Despite decades of enforced communism in East Germany that included control of law, education, and mass communications, the only difference between the two samples was that West Germans were slightly higher in openness than East Germans.
The ref is: Angleitner & Ostendorf (2000, July). The FFM: A comparison of German-speaking countries (Austria, Former East and West Germany, and Switzerland). Paper presented at the 27th International Congress of Psychology, Stockholm, Sweden.
|