|
Leave print-view
Wednesday, October 04, 2006
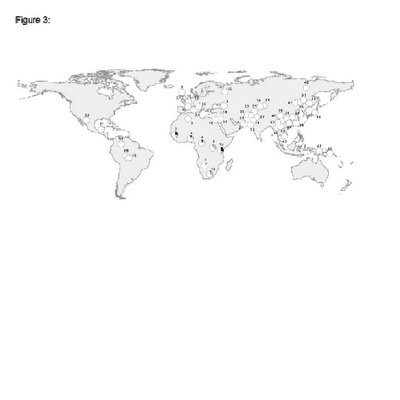
Via Dienekes comes this preprint [pdf] of a paper arguing for an ongoing recent selective sweep in the gene encoding myostatin, an inhibitor of muscle growth. The evidence for selection is based on resequencing of the gene in 146 people, which allows them to perform full-sequence-based tests for selection. They also look at the surrounding haplotypes, which are suspiciously long around the derived alleles (thus hinting at selection). They speculate that the amino acid changes they find might lead to downregulation of the protein, thus leading to increased muscle mass. Notably, these variants seem to only have a large hold in Sub-Saharan Africa. I put the frequency figure below the fold. It's hard to see; I imagine a better figure will be in the published article.
Update from Razib: First,
In general, any mutations that increase the binding affinity between the propeptide and the mature peptide could generate a relative deficiency of myostatin activity. One of the many possible adaptive implications of such an effect could be protection from muscle-wasting in times of famine, a potentially recurrent phenomenon for early agricultural societies.
Weak!!! If protection against famine is where its at how about some buff-luv for the brownz???
Since the map sucks, here is the raw data (FYI, the Makranis of Pakistan have non-trivial African ancestry because of the Muslim slave trade)
Bantu N.E., Kenya (12: 29%, 25%)
Bantu S.W., South Africa (8: 6%, 31%
Mandenka, Senegal (23: 24%, 20%)
Yoruba, Nigeria (24: 8%, 19%)
San , Namidia (7: 0%, 14%)
Mbuti Pygmies, Democratic Republic of Congo (14: 4%, 29%)
Biaka Pygmies , Central African Republic (36: 8%, 14%)
Mozabite, Algeria (Mzab)(29: 2%, 2%)
Orcadian, Orkney Islands (15: 0%, 3%)
Adygei, Russia Caucasus (17: 0%, 3%)
Russian, Russia (25: 0%, 0%)
French Basque, France (24: 0%,4%)
French, France (27: 0%, 2%)
North Italian, Italy (Bergamo) (14: 0%, 0%)
Sardinian, Italy (28: 0%, 7%)
Tuscan, Italy (8: 0%, 6%)
Bedouin, Israel(Negev) (48: 0%, 5%)
Druze, Israel (Carmel) (47: 0%, 1%)
Palestinian, Israel(Central) (49: 1%, 9%)
Balochi, Pakistan (25: 0%, 4%) Brahui, Pakistan (25:2%, 2%)
Makrani, Pakistan (25: 0%, 12%)
indhi, Pakistan (25: 0%, 4%)
Pathan, Pakistan (24: 2%, 0%)
Burusho, Pakistan (25: 0%, 4%)
Hazara, Pakistan
(22: 0%, 0%)
Uygur, China (9: 0%, 0%)
Kalash, Pakistan (25: 0%, 0%)
Han, China (43: 0%, 1%)
Dai, China (10: 0%, 0%)
Daur, China (10: 0%, 0%)
Hezhen, China (10: 0%, 0%)
Lahu, China (10: 0%, 0%)
Miaozu, China (10:0%, 0%)
Oroqen, China (10: 0%, 0%)
She, China (10: 0%, 0%)
Tujia, China (8: 0%, 0%)
Tu, China (10: 0%, 0%)
Xibo, China (9: 0%, 0%)
Yizu, China (10: 0%, 0%)
Mongola, China (10: 0%, 5%)
Naxi, China (10: 0%, 0%)
Cambodian, Cambodia (10: 0%, 0%)
Japanese, Japan (30: 0%, 0%)
Yakut, Siberia (24: 0%, 2%)
Melanesian, Bougainville (22: 0%, 0%)
Papuan, New Guinea (17: 0%, 0%)
Karitiana, Brazil (24: 0%, 0%
Surui, Brazil (21: 0%, 0%)
Colombian, Colombia (13: 0%, 0%)
Maya, Mexico (24: 0%, 0%)
Pima, Mexico (25: 0%, 0%).
|


