In
IQ and the Wealth of Nations (2002; IQatWoN) and
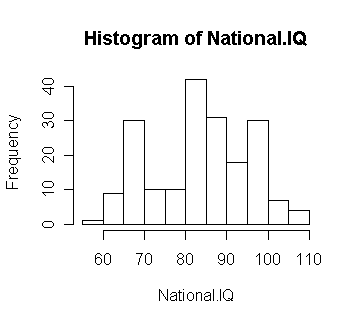
IQ and Global Inequality (2006; IQGI), Richard Lynn and Tatu Vanhanen (L&V) present measurements and estimates of average national IQ (national IQ). In IQatWoN, L&V argue that national IQ predicts per-capita GDP (sup Fig 1). In IQGI, L&V argue that national IQ predicts quality of life measures (sup Fig 2). A common criticism of both works is to question the validity of national IQ. This criticism is motivated in part by the very low scores reported for countries in sub-Saharan African. A look at the distribution of national IQ is instructive (Fig 1).
Figure 1. The distribution of national IQ values (192 countries from IQGI).
L&V address the issue of validity by comparison of national IQ values with international test scores in math and science such as TIMSS and PISA. IQGI presents data from 10 different tests, with different scoring scales, in the form of 3 tables. To get a better grasp on the question of the validity of national IQ, I reanalyzed the test score data from IQGI. For better comparison, I renormalized each set of test scores relative to the maximum test score for each assessment. This is an imperfect but sufficient technique. An unweighted average of the available test score data was used to calculate a composite national test score for the set of 62 countries for which at least 1 test score was available (Fig 2).
Figure 2. The association between national test scores and national IQ for 62 nations.
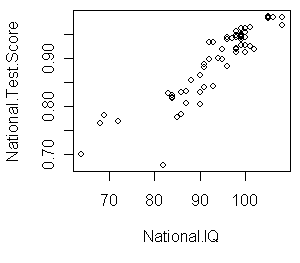
National test scores are available for a limited range of national IQ scores, with few test scores available for countries with national IQs below the mid 80s. I interpret this to mean that for countries with national IQs below ~85, the test score data is insufficient to inform the question of validity. However, for the available scores (i.e., mostly above ~85), the relationship between national IQ and national test scores is very strong (see Sup Table 1).
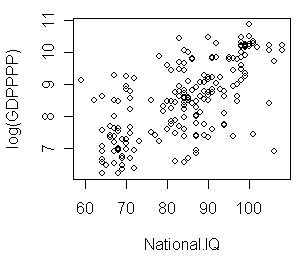
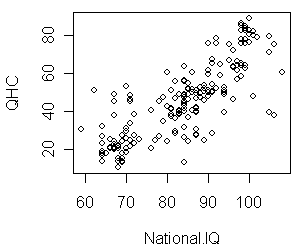
The validity of sub-80 national IQs is addressed in part by the finding that IQ correlates with GDP and QHC (Sup Figs 1,2) throughout the observed range of IQ.
Update: Although there are only four values, the sub-80 national IQs are outliers, all with positive residuals. While this is hardly informative, it trends in the direction of casting doubt on the validity of sub-80 national IQ values.
Supplemental Figure 1. National IQ correlates with GDP per-capita (192 countries from IQGI).
Supplemental Figure 2. National IQ correlates with a L&V's quality-of-life index (QHC; 192 countries from IQGI).
Supplemental Table 1. Correlation matrix for national IQ (IQ), national test score (Test), L&V's quality of life index (QHC) and log per-capita GDP (logGPD) for 62 countries.
| r | QHC | logGDP | IQ | Test |
| QHC | 1 | 0.898936 | 0.7933265 | 0.7803476 |
| logGDP | 0.898936 | 1 | 0.760138 | 0.7565582 |
| IQ | 0.7933265 | 0.760138 | 1 | 0.9008035 |
| Test | 0.7803476 | 0.7565582 | 0.9008035 | 1 |
Related papers:
* Earl Hunt and Werner Wittmann, National intelligence and national prosperity, Intelligence, In Press --examines PISA scores
* Richard Lynn and Jaan Mikk, National differences in intelligence and educational attainment, Intelligence, Volume 35, Issue 2, March-April 2007, Pages 115-121. --examines TIMSS scores
Labels: general intelligence, IQ


