It's easy to find maps of
American ancestries, but I wanted to play around with the data, and in particularly the visualization myself. So I went to the Census and got the county level numbers. The first thing I wanted to do was look at non-Hispanic white ethnicities as a proportion of non-Hispanic whites. That would for example increase the Anglo-Saxon character of the lowland South because it would remove African Americans from the equation.
All the data was from the 2000 Census, and I simply divided the % of each European ancestry group by the non-Hispanic white percentage to reweight appropriately. Here are some correlations I found:
English X Scots-Irish = 0.34
English X Irish = 0.30
English X American = -0.20
Scots-Irish X Irish = 0.37
Scots-Irish X American = -0.25
Irish X American = -0.45
I left the Scottish and Welsh out of this because their numbers were relatively small. One of the main issues with look at the "Irish" and "American" category is that both of these are probably heavily loaded with Scots-Irish. Below the fold are some maps I generated.
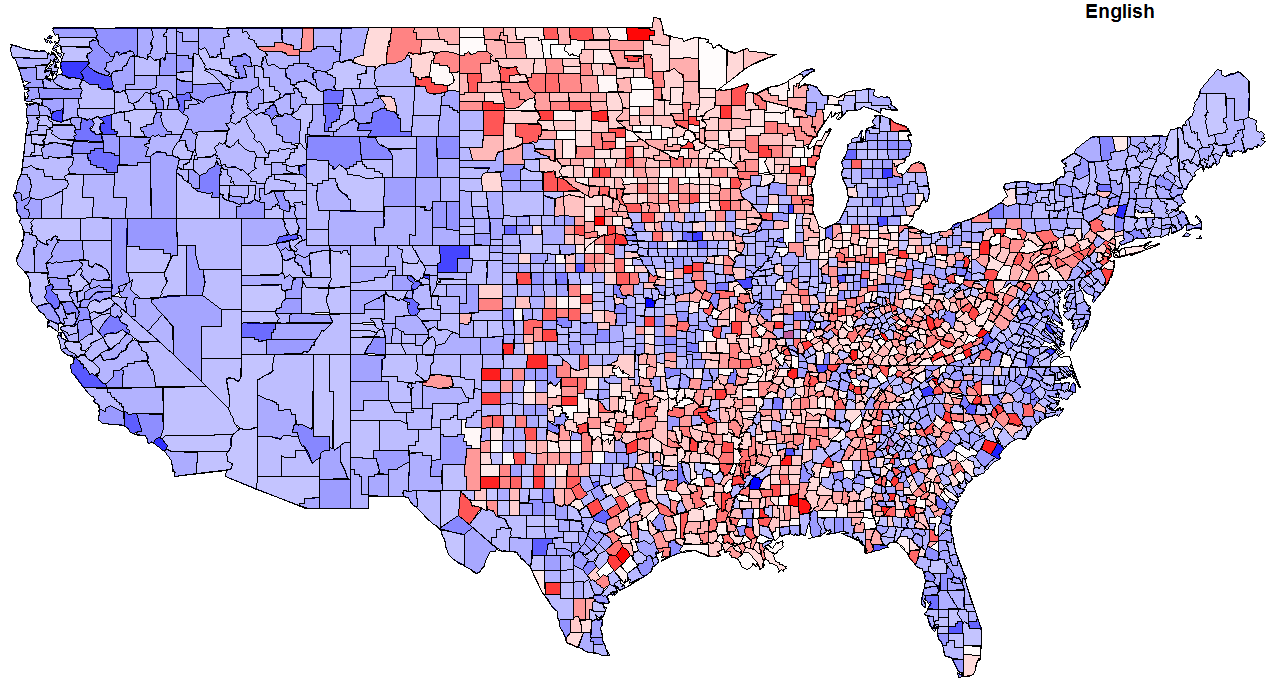
Blue = above the median for the frequency of that group nationally (the median being calculated again with non-Hispanic whites only included).
Red = below the median.
The distributions of frequencies by county tend to be
positively skewed, so the shading is covering a larger spectrum of frequencies in the blue than the red.
Min = 1.6%
25% = 8.5%
Median = 11%
75% = 14%
Max = 48%

Min = 0%
25% = 1%
Median = 2%
75% = 3%
Max = 10%

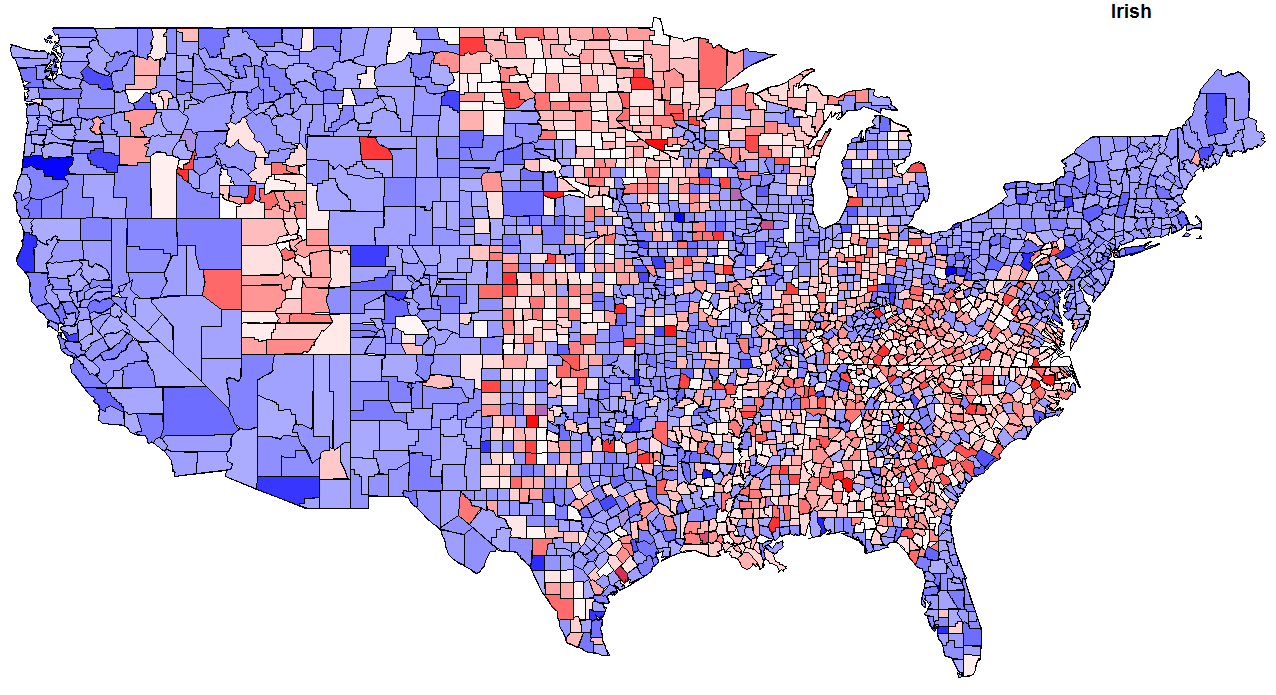
Min = 2%
25% = 10%
Median = 12%
75% = 14%
Max = 37%

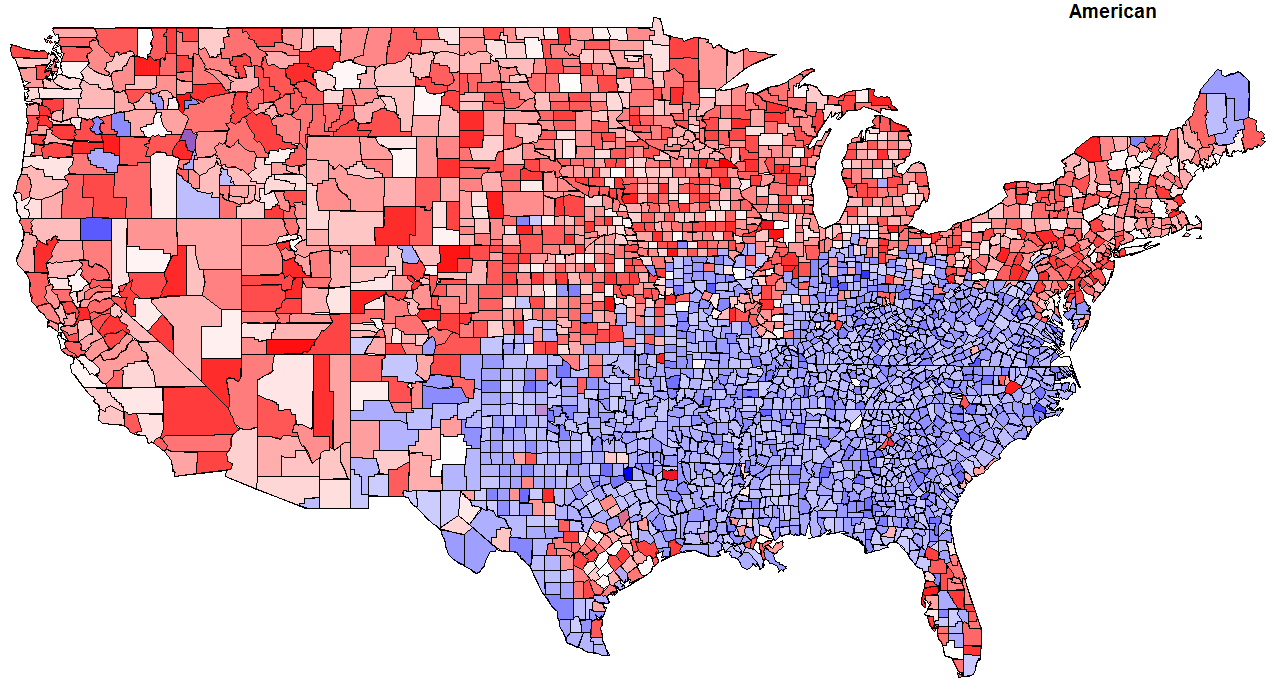
Min = 0%
25% = 7%
Median = 14%
75% = 22%
Max = 70%

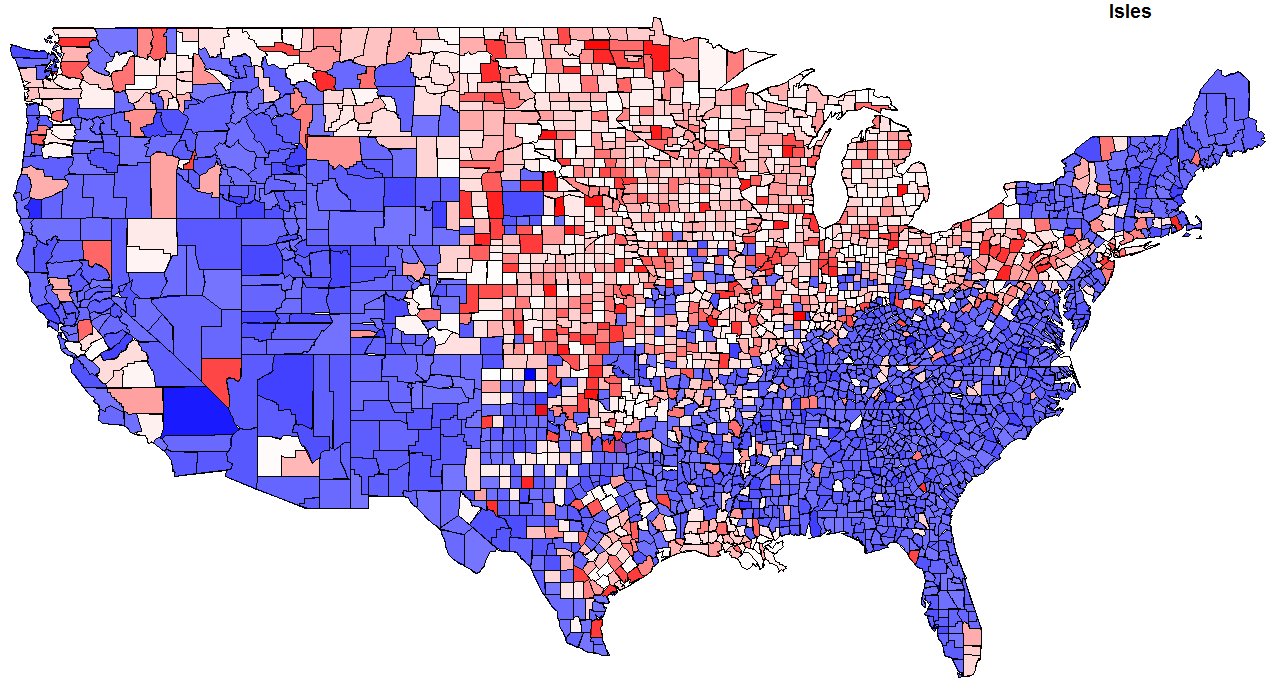
"Isles" includes Scottish & Welsh, as well as "American."
Min = 9%
25% = 39%
Median = 44%
75% = 51%
Max = 85%

Finally, here's a map where those of "Isles" origin are 50% or more of the non-Hispanic white population.

The shading for the "Isles" doesn't look right. But here's the histogram:
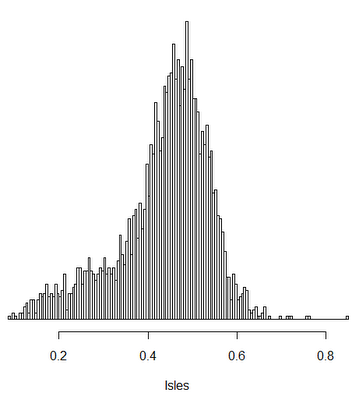
The median is 0.45. So that's probably why the blue is relatively homogeneous, the distribution is negatively skewed.
Labels: geography