|
Leave print-view
Monday, September 17, 2007
On this site, there is often speculation about population differences in various phenotypes, and the role of genetics and natural selection in said differences. Hypotheses are lovely and all, but luckily there are publicly available resources that anyone can access and browse to determine whether their hypothesis has any empirical support. In this post, I provide a basic introduction to those resources. I note here that, given the rapid progression of knowledge in the area, this is likely to remain state-of-the-art for, oh, a couple months, tops.
I. Allele frequency resources

To start, let's say you have a hypothesis about the role of gene X in phenotype Y. If populations have different distributions of Y, you might also expect them to have different distributions of alleles of X, no? Seems reasonable. Unfortunately, there's no resource of population allele frequencies available (though one might expect this to change in the near future). The best things available now are the HapMap (which has genome-wide allele frequency information on four populations-- a western European population, the Yoruba from Nigeria, the Han Chinese, and a Japanese population from Tokyo) and ALFRED (a mishmash of allele frequency data compiled from various small studies).
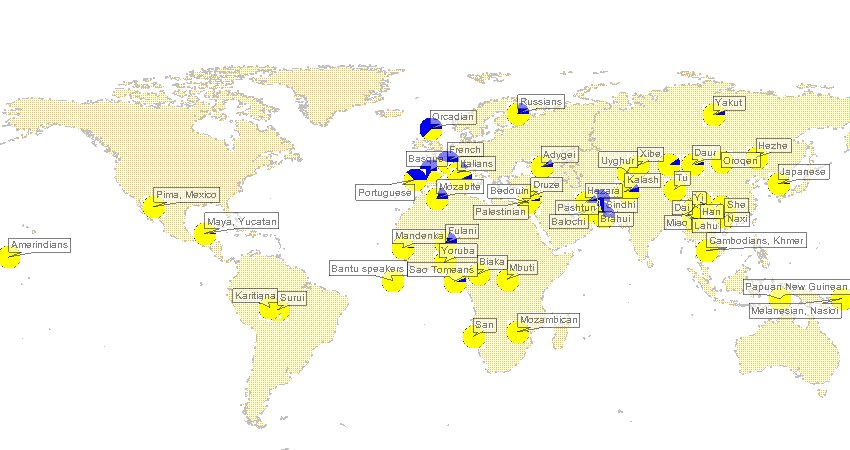
To see what these databases can do for us, let's take an example: perhaps you have heard of this trait called lactose tolerance, and a gene called lactase (LCT). The two SNPs (single nucleotide polymorphisms) that are putatively causal for lactose tolerance (ie. that allows one to digest lactose in adulthood) are located ~14000-20000 base pairs upstream from LCT, in an intron of a gene called MCM6. Let's check ALFRED to see if anyone has assembled allele frequency data on these SNPs. From the front page, I enter MCM6 in the quick search area (note I don't enter LCT, since the causal SNPs are actually in MCM6), and follow the link to the page for MCM6. The two SNPs I'm looking for are "intron 13 (C/T)" and "intron 9 (G/A)". If I click on, for example, the intron 9 SNP, I get to the entry for that SNP, where I can generate a map like the one on the right, or peruse the frequencies in table form. As seems reasonable, the T allele is common in Europeans and some Central Asian populations, but nearly absent elsewhere.
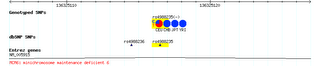
Of course, most SNPs aren't going to be in this database (I actually generally don't use ALFRED at all--any new SNP you're interested in isn't going to be in it), so let's do something similar with the HapMap. To do that, we note the intron 13 SNP is named rs4988235 (you can see this in ALFRED, but usually you won't need to--almost all SNPs are now referred to in all databases and papers by their rs number, which is standardized way of referring to SNPs). From the HapMap homepage, I click on the link to the genome browser (either one will do), and enter "SNP:rs4988235" in the "Landmark or Region" field. This brings me to the area, and one of the tracks of the browser gives the allele frequencies, as seen on the right. Again, Europeans (labeled CEU) have high frequency of the causal allele, which is absent elsewhere.
II. Selection resources
So alleles controlling the expression of LCT show population frequencies in line with explaining the differences in the distribution of lactose tolerance worldwide (to a rough extent). Now, could those alleles be under natural selection? To test this, we turn to Haplotter, a database of summary statistics designed to test for recent positive selection. The underlying data is from the HapMap, so only three populations are available (here, the Chinese and Japanese are condensed into a single Asian population).
The summary statistics calculated are iHS, D, H, and FST. I don't intend to give a full exposition of what each of these statistics is, but briefly, iHS is a summary statistic of the haplotype structure surrouning a region, which has power to detect selective sweeps that are incomplete, D and H are summary statistics of the frequency spectrum that have power to detect sweeps that are complete/nearly complete, and FST is a measure of allele frequency differentiation between populations.
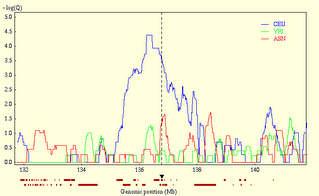
So let's take a look at LCT (in this case, since the statistics are calculated on a region, we could look either at LCT or MCM6). From the Haplotter home, I enter "LCT" in the "Query by gene" area, which brings up a number of plots. The relevant statistic here is iHS, as the alleles we're interested in are still polymorphic (see the figures above). On the right, you see the iHS plot for the region. Clearly, the European population (the blue line) has extraordinarily elevated values, and the Yoruban and Asian composite populations do not. This could be interpreted/has been interpreted to demonstrate a very strong selection on the ability to digest lactose in our recent history.
Like I said, these resources will likely be obsolete soon, but for now they're fun places to browse and test various hypotheses with. So take your favorite gene, look for selection on it in Haplotter, check the allele frequency differences in the HapMap, and hey, don't be afraid to tell us what you find.
Addendum from Razib: The comment thread below is also going to be an "open thread." You can see it to the top right in the sidebar as Find any genes?. If you think you've found something interesting through these resources, post it there! There are only a finite number of eyes looking at these heaps of data (or brains writing lines of code to analyze them), so there's no downside in adding some more....
Labels: Genetics, Population genetics
|