|
Leave print-view
Sunday, September 30, 2007
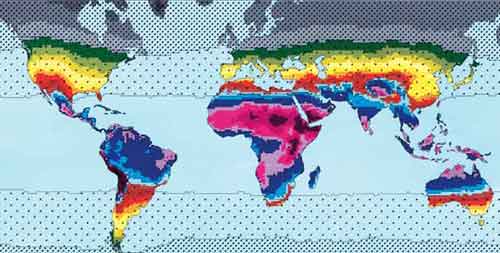 Update: Update: I've added some geographic and ethnic notations to the ones that are relevant. For example, the Indian groups which are the darkest for their latitude turn out to be a Dalit and Tribal sample. In contrast, the other groups are more socially diverse. In South Afica the Capetown sample consists of mixed-race Coloureds. I've also added geographic data for places like Ireland, since I know there are readers who might be able to confirm with local knowledge (or disconfirm). End UpdateFrom The Evolution of Skin Coloration by Nina G. Jablonski Figure 1: "The potential for synthesis of previtamin D3 in lightly pigmented human skin computed from annual average UVMED. The highest annual values for UVMED are shown in light violet, with incrementally lower values in dark violet, then in light to dark shades of blue, orange, green and gray...In the tropics, the zone of adequate UV radiation throughout the year (Zone 1) is delimited by bold black lines. Light stippling indicates Zone 2, in which there is not sufficient UV radiation during at least one month of the year to produce previtamin D3 in human skin. Zone 3, in which there is not sufficient UV radiation for previtamin D3 synthesis on average for the whole year, is indicated by heavy stippling."Below the fold I've reproduced a table that compares expected skin color and observed skin color for indigenous people. The expected is derived from a prediction equation which uses the observed values and combines them with the values from the UV map above: Predicted skin color = (annual average UVMED) X (-0.1088) + 72.7483 I also added a column which measures the difference between expected and observed and ordered it from populations which were lighter than expected to those which were darker than expected. Many of the values seem explicable via historical information (go to the paper and in the appendix you see what populations they used, that's important information); nevertheless, I am wondering about possibilities of different diet and its affect on skin color (more later)....
| Observed | Expected | Different between expected & observed | | Cambodia - Khmers | 54 | 38.99 | -15.01 | | Saudi Arabia - Saudi | 52.5 | 38.65 | -13.85 | | Peru (Nunoa - Az) | 47.7 | 34.89 | -12.81 | | Philippines (Manila - Filipino) | 54.1 | 41.53 | -12.57 | | China (Tibet - India Mussoorie - Tibetans) | 54.17 | 41.78 | -12.39 | | Vietnam | 55.9 | 43.59 | -12.31 | | Afghanistan/Iran | 55.7 | 44.55 | -11.15 | | Algeria (Aures - Chaouias from Bouzina) | 58.05 | 47.91 | -10.14 | | India (Rajasthan - Rajputs) | 52 | 42.19 | -9.81 | | Iraq/Syria (Kurds) | 61.12 | 51.5 | -9.62 | | Israel | 58.2 | 48.67 | -9.53 | | Libya (Cyrenaica) | 53.5 | 44.19 | -9.31 | | India (Southern) | 46.7 | 37.6 | -9.1 | | India (Northern - Baniya, Jat Sikhs, Haryana Jats, Khatris, Brahmans, Aroras) | 53.26 | 44.23 | -9.03 | | China (Southern, Hong Knog - Han) | 59.17 | 50.49 | -8.68 | | Pakistan | 52.3 | 44.15 | -8.15 | | Jordan (Non-village Arabs, All Arabs) | 53 | 45.36 | -7.64 | | India (Goa) | 46.5 | 38.93 | -7.57 | | Lebanon | 58.2 | 50.74 | -7.46 | | India (Punjab, England, Dehli - Sikhs, Punjabi) | 54.24 | 47.89 | -6.35 | | Morocco | 54.85 | 49.09 | -5.76 | | Libya (Tripoli) | 54.5 | 48.83 | -5.67 | | PNG (Port Moresby - Hanuabada) | 41 | 35.45 | -5.55 | | India (Bengal - Low Caste, Kayastha, Brahman, Vaidya, Rarhi Brahman) | 49.73 | 44.33 | -5.4 | | Tunisia | 56.3 | 52.03 | -4.27 | | Nepal (Eastern - Jirel, Sunwar, Sherpa, Tamang, Brahman, Chetri) | 50.42 | 46.31 | -4.11 | | Spain (Leon - Meseta, Cabrera, Bierzo, Montana, Maragateria) | 64.66 | 60.8 | -3.86 | | PNG (Mt. Hagan - Western Highlands) | 35.35 | 31.56 | -3.79 | | Turkey | 59.15 | 55.56 | -3.59 | | Spain (Basque - Basque and non-Basques) | 65.7 | 62.38 | -3.32 | | Botswana (Kalahari - Central Bushmen, Yellow Bushmen at Lone Tree, Central San, Yellow Bushmen at Takashwani, Central San, Yellow Bushmen at Ghanzi, Central San) | 42.4 | 39.45 | -2.95 | | South Africa (Namaqualand, Hottentot) | 46.8 | 43.91 | -2.89 | | Libya (Fezzan) | 44 | 41.31 | -2.69 | | South Africa (Warmbath - Hottentot) | 43.75 | 41.14 | -2.61 | | Ethiopia (Highland - Residents of Debarech (3000 m altitude)) | 33.55 | 31.35 | -2.2 | | Sudan | 35.5 | 33.45 | -2.05 | | Brazil (Parana - Guarani) | 47.2 | 45.29 | -1.91 | | Germany (Mainz - German and American Whites) | 66.9 | 65.21 | -1.69 | | Netherlands (Dutch (mainly resident in Utrecht)) | 67.37 | 65.94 | -1.43 | | Brazil (Caingang Indians) | 49.4 | 48.53 | -0.87 | | Peru (Maranon - Aguarana Indians) | 43 | 42.28 | -0.72 | | South Africa (Cape - Cape Coloureds) | 50.96 | 50.71 | -0.25 | | India (Nagpur - Mahar) | 41.3 | 41.53 | 0.23 | | UK (Cumberland) | 66.75 | 66.99 | 0.24 | | Average | 46.18 | 46.52 | 0.34 | | Mali (Dogon) | 34.1 | 34.54 | 0.44 | | PNG (Goroka) | 33.3 | 34.2 | 0.9 | | Ethiopia (Residents of Adi-Arkai (1500 m altitude), | 31.7 | 32.7 | 1 | | UK (Wales - Isle of Man, Merthyr Tydfil, North Pembrokeshire) | 65 | 66.15 | 1.15 | | Ireland (Carnew) | 64.5 | 65.84 | 1.34 | | UK (Northern) | 66.1 | 67.49 | 1.39 | | Kenya | 32.4 | 34.21 | 1.81 | | Ireland (Ballinlough) | 65.2 | 67.11 | 1.91 | | PNG | 35.3 | 37.26 | 1.96 | | Ireland (Rossmore) | 64.75 | 66.73 | 1.98 | | Ireland (Longford) | 65 | 66.99 | 1.99 | | Belgium | 63.14 | 65.66 | 2.52 | | Japan (Central) | 55.42 | 58.51 | 3.09 | | Japan (Southwest) | 53.55 | 56.68 | 3.13 | | South African (S. A. Negroes (73% Tswana and Xhosa), Bantu (96% Xhosa)) | 42.5 | 45.67 | 3.17 | | Tanzania (Sandawe) | 28.9 | 32.13 | 3.23 | | UK (London- Europeans) | 62.3 | 65.84 | 3.54 | | Namibia (Rehoboth Baster - Black Bushmen at Bagani) | 32.9 | 36.49 | 3.59 | | India (Angami Nagas) | 44.6 | 48.85 | 4.25 | | Zaire (Congolese except 3 Cameroon females) | 33.2 | 37.46 | 4.26 | | Japan (Hidakka - Ainu) | 59.1 | 63.58 | 4.48 | | PNG (Karker - Karker Islanders) | 32 | 37.25 | 5.25 | | Russia (Chechen) | 53.45 | 59.04 | 5.59 | | Burkina Faso (Kurumba from Roanga) | 28.6 | 34.23 | 5.63 | | PNG (Lufa - Lufa villagers) | 31 | 36.88 | 5.88 | | Japan (Northern) | 54.9 | 61.34 | 6.44 | | Tanzania (Nyatura) | 25.8 | 34.12 | 8.32 | | Swaziland | 35.6 | 44.62 | 9.02 | | India (Orissa, Koraput Town - Bareng Paroja, Bado Gadaba) | 32.05 | 41.52 | 9.47 | | Zaire | 29.4 | 39.43 | 10.03 | | Chad (Ndila Sara - Madjingay) | 24.6 | 34.77 | 10.17 | | Liberia (Mainz - Africans from Ghana and Liberia) | 29.4 | 40.52 | 11.12 | | Malawi (Mainly Cewa) | 27 | 38.67 | 11.67 | | Nigeria (Yoruba) | 27.4 | 39.62 | 12.22 | | Namibia (Kurungkuru Kraal, Tondoro) | 25.55 | 38.29 | 12.74 | | Cameroon (Fali Tinguelin) | 21.5 | 34.37 | 12.87 | | Nigeria (Ibo) | 28.2 | 41.86 | 13.66 | | Greenland (Southern - Eskimo Ammassalimiut) | 55.7 | 70.31 | 14.61 | | Namibia (Okavango Bantu, M’bukushu at Bagani, Kuangali) | 22.92 | 38.63 | 15.71 | | Australia (Darwin - Aborigines) | 19.3 | 36.24 | 16.94 | | Mozambique (Chopi) | 19.45 | 43.84 | 24.39 |
Notes: I'm skeptical of the accuracy of some of the reflectance measures. The authors report which ethnic groups they used for sampling in the appendices, so I would ask readers to look in there if they think some of these measures are questionable (I'll have a follow up post on this). They also assume that these "indigenous" peoples (which is, admittedly, a flexible definition) are well adapted to their local UV regime, and that other factors are controlled. Jablonski's thesis is that skin color is driven by two opposing forces: adaptation to high levels of UV which break down folate and increase birth defects, and, the need to synthesize vitamin D through the interaction of UV and biochemicals in the skin. Variation in diet and other possible selective forces aren't of much concern to her, and so she generated her expected skin color values assume that UV is the primary independent variable. My own hunch is that the far lighter than expected skin color across much of Asia is due to Vitamin D deficiency induced by the extreme carbohydrate biased diets of these populations. At this point this is just a tentative hypothesis, but, there has been selection for alleles known to be implicated in generating lighter skin in both South and East Asia within the last 10,000 years.
Labels: Genetics, Pigmentation
|


