|
Leave print-view
Tuesday, June 02, 2009
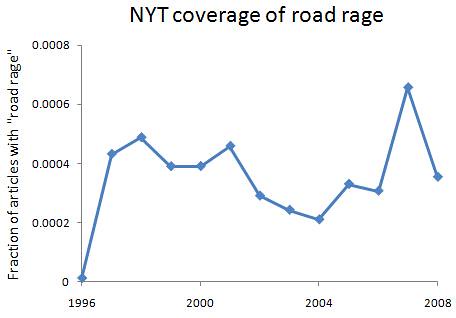
Click the tab below the body of this post to read previous entries in the series about how previous generations were more depraved. One way to look at how civilized we are is to see how we behave in situations where our conduct can mean the difference between life and death for those around us -- for example, when we drive our car. Traffic deaths, of course, reflect properties of the car as much as the people involved, but teasing the two apart turns out to be pretty simple in this case. In my brief review of Daniel Gardner's book The Science of Fear, I gave a few examples of how media coverage of some threat was outta-whack with the underlying risk, namely homicide and rape. Gardner spends a few pages talking about the epidemic of "road rage" that was allegedly sweeping across the country not too long ago, so why don't we have a look at what the data really say about when road rage may have been greater than usual. First, here's a quick view of media coverage of "road rage," which begins in 1996:
What about actual traffic deaths, though? The data come from the National Safety Council, as recorded across several versions of the Statistical Abstract of the United States -- which, btw, is much cooler than the General Social Survey or the World Values Survey if you want to waste some time crunching numbers. I tracked the data back as far as they exist in the Stat Ab, and they include four ways of measuring traffic death rates. Here are the graphs:

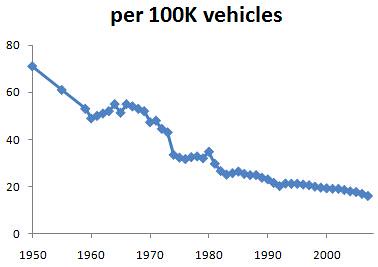
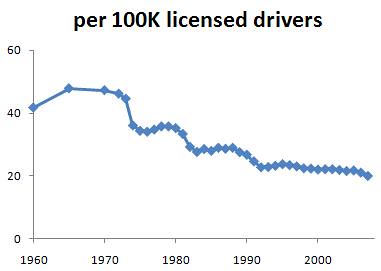
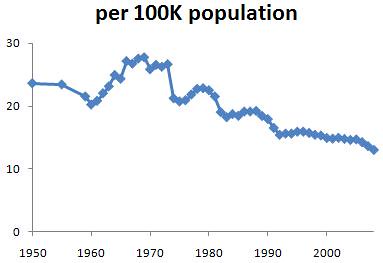
The first is the most instructive -- it measures the number of deaths compared to the number of vehicles on the road and how long they're on the road. The other three measure deaths compared to some population size -- of vehicles, of drivers, or of the whole country -- but even if population size is constant, we expect more deaths if people drive a lot more. The distinction isn't so crucial here since the graphs look the same, but I'll refer to the first one because what it measures is more informative.
From 1950 to 2008, there's a simple exponential decline in traffic deaths (r^2 = 0.97). As roads are made safer, as all sorts of car parts are made to boost safety, and as people become more familiar with traffic, we expect deaths to decline, and that's just what we see. I looked at earlier versions of the Stat Ab, and there is a similar exponential decline in railroad-related deaths from 1920 to 1959 -- again, probably due to improving the technology of railroads, trains, and so on.
However, aside from the steady decline that we expect from safer machinery, there is a clear bulge away from the trend during the years 1961 - 1973. Although I haven't researched it, it seems impossible for roads to have went to shit during that time but not during the other times, or that cars made then were even less safe than the ones made before or after. The obvious answer is that people were just more reckless and/or hostile toward their fellow man in that period.
There's no other huge departure from the trend, so if any time period has been characterized by "road rage," it was The Sixties (which lasted until 1973 or '74). Consider the age group whose brains are most hijacked by hormones, and maybe by drugs and alcohol too -- say, 15 to 21 year-olds. The oldest members of this group who were driving during the road rage peak were born in 1940, while the youngest ones were born in 1958. Hmmm, born from 1940 to 1958 -- Baby Boomers. (Those born after 1957 - 8, and before 1964, are not cultural Boomers.) And this doesn't seem to be an effect of lots more teenagers on the road than at other times -- there have been echo booms afterward and yet no big swings away from the trend.
When the media and everyone hooked in to the media began talking about road rage 10 to 15 years ago, there was nothing new in the traffic death story -- indeed, the rate was continuing its decades-long decline. If you just want to know what is going on right now, the media may not be so bad at giving you that info. But this serves as yet another lesson to not believe anything they say, or imply, about trends unless there is a clear graph backing them up (or, in a pinch, a handful of data-points sprinkled throughout the prose).
I located, collected, analyzed, and wrote up all of the relevant data -- stretching back nearly 60 years -- in less than one day, and only using the internet and Excel. This shows us again that journalists are either too clueless, too lazy, or too stupid to figure anything out.Labels: culture, Media, previous generations were more depraved, Technology
|


