|
Wednesday, December 16, 2009
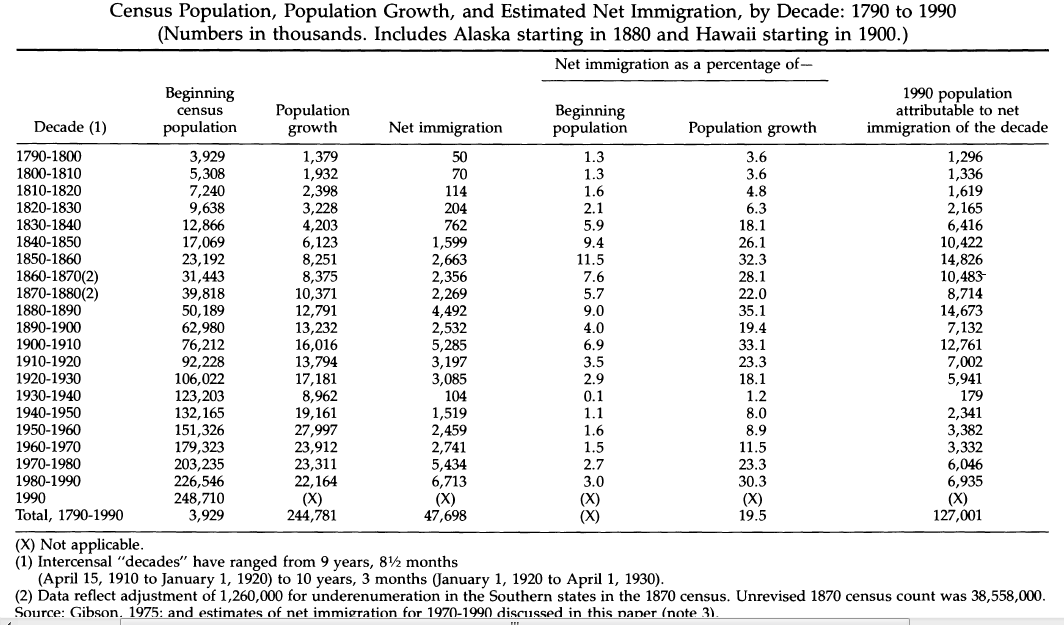
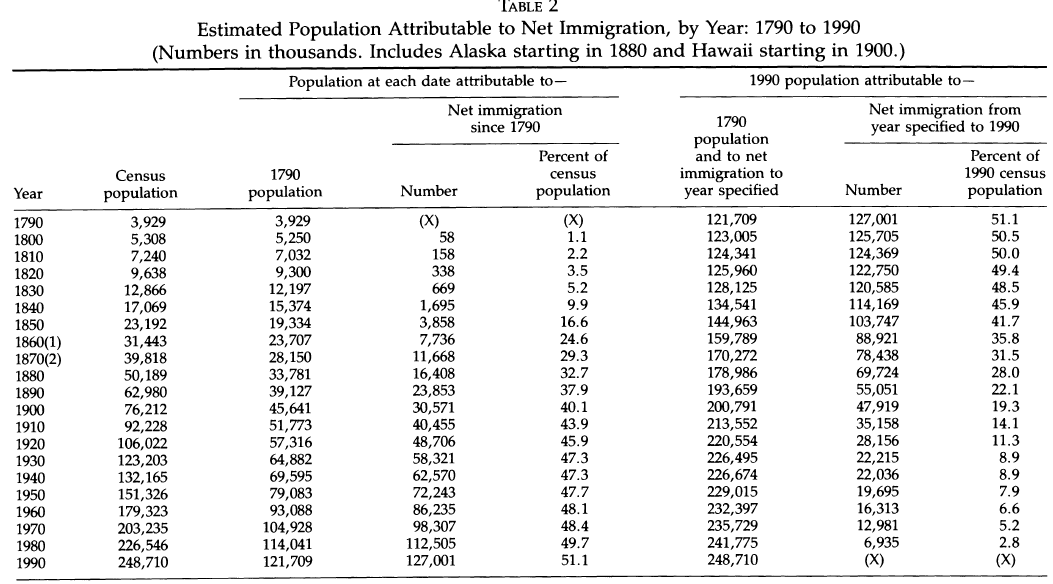
A few weeks ago I referenced Campbell Gibson's paper, The Contribution of Immigration to the Growth and Ethnic Diversity of the American Population, which estimated that ~1990 50% of the population of the United States could be attributed to those enumerated in the Census of 1790. In other words, the first generation of white settlers who were citizens of an independent republic, and the free and enslaved blacks. More specifically,
  Labels: Demographics
Sunday, November 22, 2009
One of the mantras of the new age is that European nations have to deal with diversity, something that's new to them. This actually ahistorical. Some military units in the Austro-Hungarian Empire actually used English as the lingua franca because of their ethnic diversity (due to those who returned from the United States, see 1848: Year of Revolution), while the French language and identity as dominant within the political unit of France is an artifact of the 19th century (see The Discovery of France: A Historical Geography). But one point which was brought home to me was the diversity of the United Kingdom in 1800. I knew of course that Ireland before the famine was 1/3 of the population of the United Kingdom, but I hadn't thought through the political ramifications. In The Cousins' Wars: Religion, Politics, Civil Warfare, And The Triumph Of Anglo-America Kevin Phillips highlights an important set of facts about the United Kingdom:
1) The constant migration of dissenting Protestants in the 17th to 18th century to America resulted in a firming up of the position of the Anglican mainstream within England. 2) The massive migration (as well as deaths due to famine) of Irish Catholics in the 19th century solidified the Protestant character of the United Kingdom. Below the fold is a comparison of England and Ireland in terms of population between 1800 and 1910. 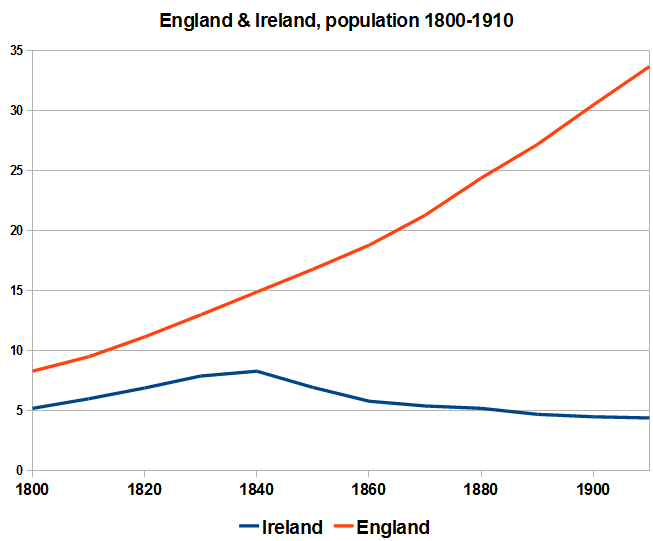 Here is the biography of Patrick Kennedy, great-grandfather of John F. Kennedy: By the time Patrick reached adulthood, both his parents were apparently dead and the family homestead was controlled by his older brother John Kennedy, more than a dozen years Patrick's senior, who was already married and the father of four children. The eldest son normally inherited whatever claims existed to the family's farm. Because of the life-threatening scarcity of food and resources, the rest of the children, such as third son Patrick Kennedy, usually were expected to leave for the New World. Patrick also had a brother James and a sister Mary. Note: I am aware of the fact that some of the decrease in Ireland's population and England's rise is due to emigration from the former to the latter. Removing this would not change the qualitative relation much. Labels: Demographics
Wednesday, May 13, 2009
I was in the bookstore and decided to look through God Is Back: How the Global Revival of Faith Is Changing the World. The authors work at The Economist, so I assumed it was going to be more reportage than a popular distillation of scholarship. I haven't read the whole thing, but that seems about right, skimming through I kept picking up errors or tendentious assertions. The very title is, in my opinion, only tenuously rooted in any factual secular trend. Secularization theory's overreach has given rise to a huge counter-literature which argues for the progressively more fervent religiosity of the world. But much of this has little to do with scholarship. Just as George Lakoff knows his audience, and so tailors his "scientific" message in the interests of getting his ideas out there through book sales, so the popular press knows very well that articles and books about the resurgence of religion will sell well. After all, there are many religious people out there. A few years ago David Aikman published Jesus in Beijing: How Christianity is Transforming China and Changing the Global Balance of Power. The book had a natural base when it came to potential sales. No matter that he tended to push highbound estimates for the number of Christians in China, the business is demand side driven.
We don't need to talk about China. There's a nation where the mainstream media has been hyping religious revival for the past generation that hasn't been happening: the United States. As far back as the 2000 Religious Identification Survey it was clear that the 1990s were a period of major decline in denominational affiliation. Those data have been confirmed over the past decade. The religious revival in the United States was simply in the minds of hopeful evangelicals, and terrified secular liberals who wanted to hype the power of the religious Right so as to elicit a counterresponse from the Left. And of course cover stories on the rise of evangelical America sell copy (again, scared secularists and enthusiastic evangelicals). So what's the data around the world? Let's look at the World Vaues Survey. There are five "waves" to the WVS, and of these the last four have had a question of the form: For each of the following aspects, indicate how important it is in your life. Religion. The answers are: 1 Very important 2 Important 3 Not at all important Below the fold I've the data from waves 2, 3, 4 and 5 for all the nations. Some obviously don't have data for a particular wave. Wave 2 is from around 1990 (some are as early 1989, with a few as late as 1993). Wave 3 is from around 1995-1998. Wave 4 around 2000. And wave 5 is from 2005-2008. The numbers represent the proportion who agreed that religion was "very important."
Yes, there are almost certainly issues about representativeness across these samples over the years. And the data are spotty. But in any case, there a few cases where we have other sources which confirm the trend line. Spain has become notably more secular over the past 20 years. China has seen an increase in religion over the past 20 years. But I don't see a very strong trend in either direction on a worldwide basis, and I assume a lot of the jumping around individually probably has to do with the nature of the sample . The point is that there hasn't been a massive secular trend in increased religiosity. But who cares? John Micklethwait and Adrian Wooldridge will sell a lot of copies of their book predicated on a likely moronic axiom (judging by the elementary errors that I quickly spotted they don't know much about the topic besides what they read in newspapers). Here's a line graph where I placed all the nations with at least 3 data points. See if you can discern anything from the noise.... 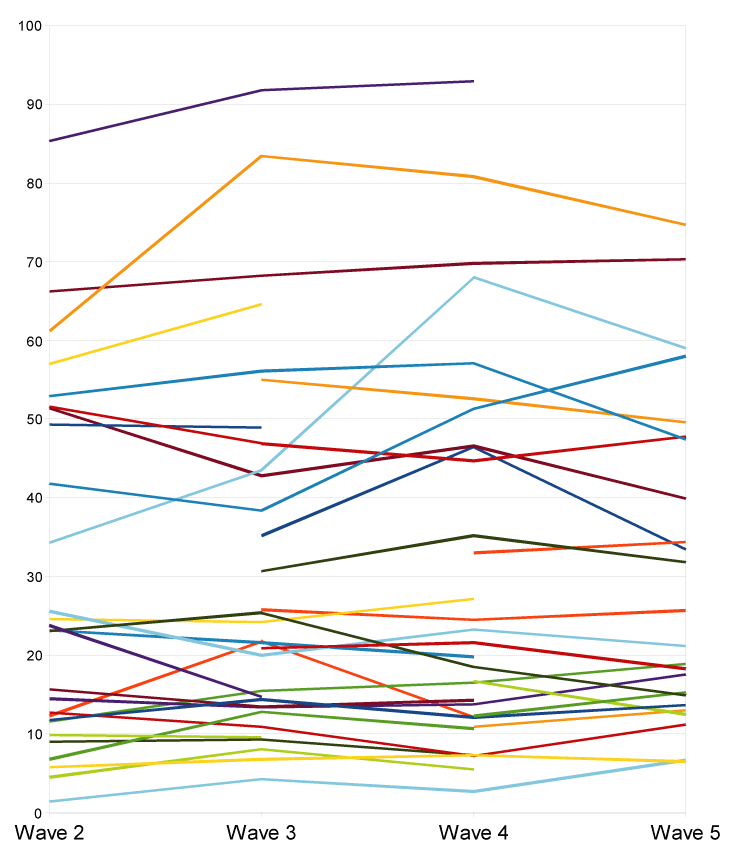 I invite readers to weight the data by the populations of these nations and see if, for example, the likely enormous relative increase in religiosity in China from hardly anyone being religious to a small minority being religious is making a worldwide difference. Doing a scatter of wave 2 on wave 5 for those nations which had those two gave an incredible slope of 1.01! Labels: data, Demographics, Religion
Thursday, January 08, 2009
[Updated]
After declining pretty steadily from 1991 to 2005, in 2006 teen birth rates showed a slight uptick. Rather than swallow what the mass media and doomsaying blogosphere infers, read the report for yourself -- what you want to know is contained in the first 5 to 10 pages. Since most people worry about the long-term trend, and where things are going, I've taken data from the report's tables and put them into easy to understand time-series graphs, broken down by race and ethnicity. I'll then address a few of the larger issues. All birth rates are live births per 1000 women in a given group. I'll only look at births to 15 - 17 year-olds because mothers younger than that are even rarer, and people freak out less about mothers at or above the age of majority. The 18 - 19 graphs look similar, and you can create them yourselves using the NCHS' report and Excel. Update: see the end of the post for the one 18 - 19 year-old graph that is different, which shows birth rates among Hispanic 18 - 19 year-olds increasing since 2000. [End update] Most of the recent increase is due to 18 - 19 year-old births, so that's another reason not to care about an increase in "teen pregnancy" -- 18 and 19 year-olds are adults. Moreover, there is an increase across all age groups, especially 20 - 24. So, there's nothing special about teens of any age -- the 15 - 17 year-olds increased a bit, while the 18 and 19 year-olds appear to really be part of a larger group of 18 to 24 year-olds. (Nature doesn't adhere to our numbering system, where there's a bright line between 19 and 20.) Births are just up overall, and the closer we get to the female fecundity peak in the early 20s, the stronger the signal is. First, the NCHS has data going back to 1970, although it is not broken down by race. Still, here is that graph:  There is a downward trend throughout, with a steady oscillation around that trend. So, the rate will probably continue to decline into the following decades, and we shouldn't be fooled by a temporary increase. For the near future, it looks like the rate will remain pretty flat for about 5 years, then start to increase again, with a decrease again after that, all on a downward trend. Next, the data with race broken down begins in 1980 and includes White, Black, Asian / Pacific Islander, and American Indian / Alaskan Native. The graph with Hispanic ethnicity is further down. Here are the birth rates for Blacks and AIANs, and for Whites and Asians:  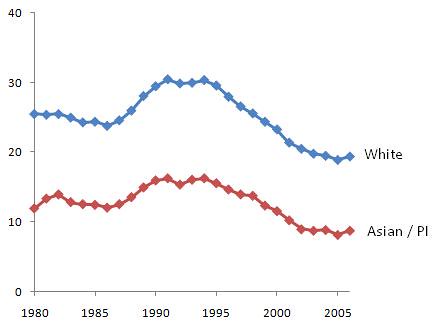 Since the graphs look so similar to the all-race graph, we can assume that from 1970 - '79, the birth rate declined across all races. Again, we see a downward trend with a steady oscillation around it. In no case is the 2006 uptick dramatic, and it looks just like it does in the all-races graph. So again, the rates will probably remain mostly flat for the next 5 years, increase, then decrease, following the overall downward trend. Finally, the data on Hispanic and non-Hispanic groups starts only in 1990. Here are the trends:  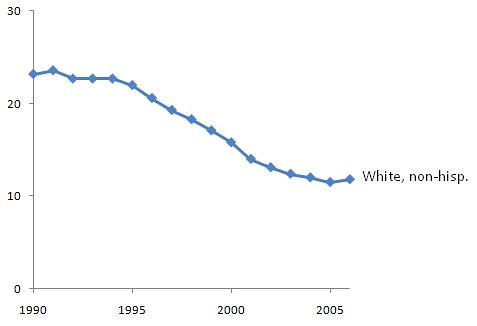 The patterns are the same as in the other graphs, so it wouldn't be too risky to assume that, if we had the actual data, they'd look like they do in the first graph back to 1970. There are clear race and ethnic differences -- the Black line is always above the White line -- but the downward trend and presence of oscillations does not have to do with race or ethnicity. Whatever causes them is at a societal level. The only interesting difference in these Hispanic graphs is that non-Hispanic Blacks and Hispanics have switched in the rank order: we now have more of a Hispanic problem than a Black problem. That should give people a clearer idea of what is going on. It's silly to forecast based on two data-points -- last year and this year -- when there is plenty of other data to help out. The reason people do this is because it allows them to indulge their desire to imagine the end of the world. The slightest aberration or reversal of a reassuring trend is greeted with exhilaration by the declinist junkies -- "So there's hope that the world is doomed after all!" Furthermore, these data are all on birth rates, not pregnancy rates. We won't know what the teen pregnancy rate was until we have abortion data, and the NCHS says that won't be for awhile. (The most recent data are from 2004.) For all we know, pregnancy rates are the same or lower than before, but more of those who do get pregnant may opt to keep the kid. I suspect something like that is true based on adolescent sex behavior data that I've already written about. All measures of sluttiness among teenage girls -- having sex at all, having 4+ partners, not using a condom, etc. -- have declined from 1991 to 2007. Indeed, there is no change in any of the measures from 2005 to 2007. See here for the data from the YRBS. This suggets that the 2006 uptick in birth rates was not due to greater rates of bad behavior among teenagers, but to a greater aversion to abortion among today's young people. A statement by the National Campaign to Prevent Teen and Unplanned Pregnancy hopes for the worst about these YRBS data: For teens in school, YRBS data for 2005 and 2007 reflected small increases in sexual activity and decreases in contraceptive use that were not statistically significant, but the changes are likely large enough to account for the 3% increase in the teen birth rate (and likely a similar increase in the teen pregnancy rate) between 2005 and 2006. The part that I've boldfaced is mostly a lie. If you look at the YRBS data in the link above, there is an apparent but non-significant increase of 1.0% in the percent who have had sex, from 2005 to 2007. However, there was also an apparent increase of 1.1% from 2001 to 2003, and of 1.5% from 1997 to 1999 -- greater than the most recent apparent increase, yet which resulted in no uptick in teen births. As for percent who are currently sexually active, there is an apparent but non-significant increase of 1.1% from 2005 to 2007 -- but there were similar increases from 2001 to 2003 (up 0.9%) and 1997 to 1999 (up 1.5%). The same is true for percent who use birth control pills. Only the percent who used a condom the last time they had sex shows an apparent and non-significant decrease that isn't matched by similar apparent decreases in previous years. Again, though, the change is not significant. Here's what the CEO of the National Campaign told USA Today: Sarah Brown, CEO of the National Campaign to Prevent Teen and Unplanned Pregnancy, says she is less inclined to believe abortion is driving higher teen birth rates and suggests that increases in high-profile unmarried births in Hollywood, movies and even politics is a significant factor for impressionable teens. You have to admire her candor and pity her desperation: she admits that the purported causes came years after the effect. So, rather than Hollywood influencing a social trend, the already existing social trend began to reach even into Hollywood. After that happens, there may be positive feedback, but let's be clear about who started it. In general, Hollywood doesn't want to influence any social trend -- they want to figure out what the existing trends are and pander to them to get rich. They're greedy capitalists, not mad scientists. When I am elected dictator, my first campaign to improve the people's mental health will be to censor anyone who, in a mainstream forum, argues that 1) Hollywood is responsible for degrading our morals, 2) poverty causes crime, 3) "it's the parents' fault," or 4) these kids these days don't know what good music is. Ah, to read the newspaper without feeling the urge to strangle 5 of the 6 people quoted -- that oughtta make everyone feel a bit more sane. Note: here's the graph for non-Hispanic Black and Hispanic 18 - 19 year-olds: 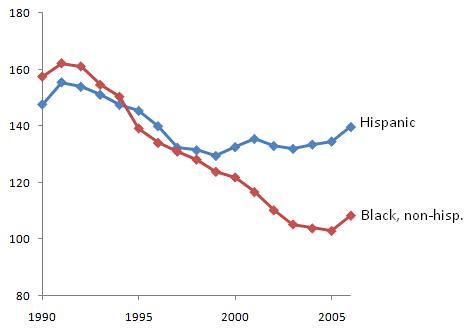 So as with the 15 - 17 year-old case, Hispanics have overtaken Blacks, and also that their rate has been increasing since 2000. This is the only worrisome data -- and yet another reason to slam our borders shut to anyone who didn't graduate college. So as with the 15 - 17 year-old case, Hispanics have overtaken Blacks, and also that their rate has been increasing since 2000. This is the only worrisome data -- and yet another reason to slam our borders shut to anyone who didn't graduate college.Labels: babes and hunks, Demographics, previous generations were more depraved
Tuesday, July 29, 2008
Brooks sets out to share his wisdom on the root causes of America's past success and why we're faltering of late. He writes:
As Claudia Goldin and Lawrence Katz describe in their book, "The Race Between Education and Technology," America's educational progress was amazingly steady over those decades, and the U.S. opened up a gigantic global lead. Educational levels were rising across the industrialized world, but the U.S. had at least a 35-year advantage on most of Europe. In 1950, no European country enrolled 30 percent of its older teens in full-time secondary school. In the U.S., 70 percent of older teens were in school. What could have happened in the 1960s that could, by 1970, lead to the cessation of the educational gains we had made over the 50 - 75 years? Has anyone looked at Senator Ted Kennedy's handiwork? Well, Brooks certainly doesn't even entertain the notion that the demographic nature of the US today is different from what it was during most the century preceding the 1965 Immigration Reform Act. Moreover, during the sustained periods of immigration restriction the cultural focus was squarely on assimilation and unlike today, educational resources were not squandered on celebrating diversity, rather they were targeted towards moving all children along a common cultural vector. Goldin and Katz describe a race between technology and education. The pace of technological change has been surprisingly steady. In periods when educational progress outpaces this change, inequality narrows. The market is flooded with skilled workers, so their wages rise modestly. In periods, like the current one, when educational progress lags behind technological change, inequality widens. The relatively few skilled workers command higher prices, while the many unskilled ones have little bargaining power. Having an immigration policy which pulls in tens of millions of 6th grade educated, Spanish-speaking immigrants is a policy that creates inequality. Goldin and Katz would do well to control for immigrant status, legal and illegal, in the ranks of the low skilled. The meticulous research of Goldin and Katz is complemented by a report from James Heckman of the University of Chicago. Using his own research, Heckman also concludes that high school graduation rates peaked in the U.S. in the late 1960s, at about 80 percent. Since then they have declined. Again, demography matters. When we celebrate diversity and when we hold all cultures to be equal then we discount the importance that cultural practices, traditions and views have on real world factors, like education and economic productivity. Heckman notes that "some children" benefit from family practices that promote human capital development, but that many don't. I'm willing to wager that racial and cultural factors correlate to a good deal of this disparity. It's not globalization or immigration or computers per se that widen inequality. It's the skills gap. Boosting educational attainment at the bottom is more promising than trying to reorganize the global economy. It's fantasy to posit that the skills gap is independent of group measures of human capital stock. ParaPundit shows the dismal embrace of higher education by Hispanics even after 4 generations in the US. America rose because it got more out of its own people than other nations. That stopped in 1970. There are two things wrong with this claim. First, measuring what a country gets from it's people is simply another way of referencing the concept of productivity and US productivity increases didn't stop in 1970. In fact, from 1995-2005 the US experienced a 2.35% annual rate of productivity growth, which was only exceeded by the rates experienced in Iceland, Finland and Sweden. We're clearly able to "get more" out of our citizens. Brooks' conflates educational attainment in a nation with productivity growth. Clearly, some segments of our population excel at educational attainment while others groups stumble. Secondly, it would help to disaggregate the data on educational attainment and productivity growth by demographic group. If we look at Canada, with it's massive surge of Asian immigrants, we see that these newcomers to Canada are not having the same dismal educational experience as America's Hispanic immigrants and Canada is managing to "get more" (36%+ of Chinese immigrants have some university, only 12% show no educational attainment) out of its new citizens than the US is managing with our new Hispanic residents. Even when we look beyond the immigrant generation and focus on their children, we see that Canada's policy of seeking to maximize human capital stocks when making immigration decisions results in these immigrants having children who exhibit better academic performance compared to our first generation Hispanic students despite the fact that Canada's public schools aren't financed as generously as ours (OECD Excel File) (Education Spending/Student 2000: Primary Level - Canada $6,120, US $7,980; Secondary Level - Canada = $5,947, US $8,855; Tertiary Level - Canada = $14,983, US = $20,358) and yet Canada isn't getting as "much out of" their citizens in terms of economic productivity as the US. So, whatever the US is doing right in terms of productivity growth it still manages to surpass most developed countries even when handicapped by unique demographic challenges. If Brooks would like to see educational attainment increase over time then he should really begin advocating that we stop importing poverty, stop fostering cultural diversity and begin trying to assess human capital stocks in our immigrants. Here's a hint for Brooks - you need to understand the parameters of a problem before you can hope to discuss it accurately - leaving out demographics when questioning national performance will forever lead you to misanalyze. Peoples and cultures matter. Don't take my word for it - here's what the official demographer of Texas has to say: Texas is changing. It is growing older and browner, with the elderly and Hispanic populations growing at an unprecedented rate. And as the populations increase, so will the challenges. Labels: Demographics
Saturday, May 31, 2008
Walker's World: French births soar:
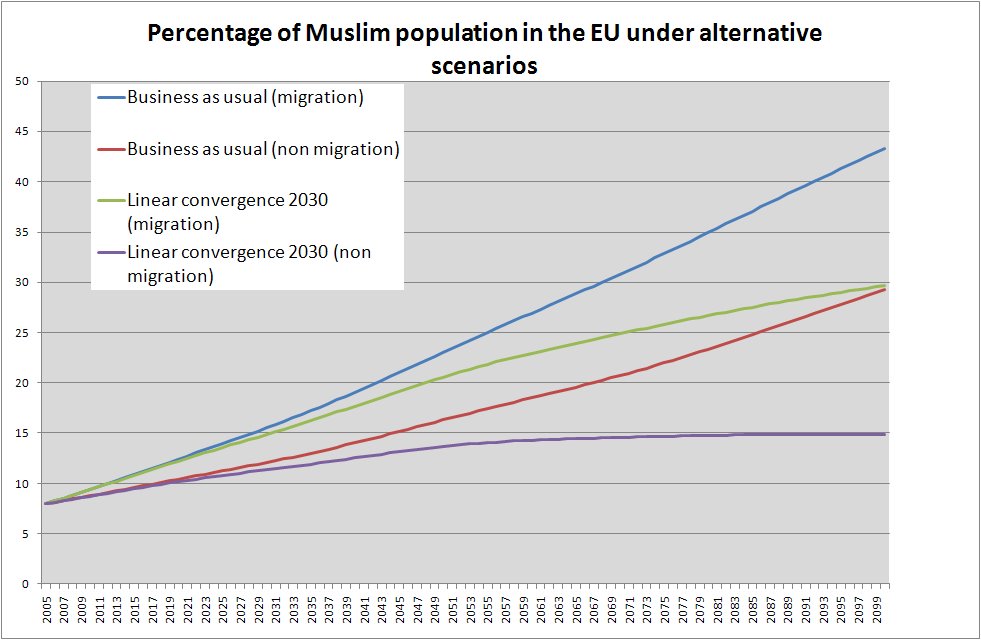
The second development to note is that INED, France's National Institute of Demographic Studies, has done some detailed research and concluded that France's immigrant population is responsible for only 5 percent of the rise in the birthrate and that France's population would be rising anyway even without the immigrant population. A few points. First, even if there is convergence differentials still do matter. One thing I noted when surveying data on Mormon fertility is that though it has converged with non-Mormon fertility, the "floor" still usually remains higher than that of local non-Mormons. I'm not worried about a Mormon future of course because it is also a religion with a relatively high defection rate, but long term persistence of small differences do matter. Second, projecting to the year 2100 as many do today is very problematic. In the late 19th century some bureaucrats in the Ottoman government were relieved as the Christian Balkan provinces fell away through independence or assimilation into the Austro-Hungarian monarchy. The reason being the fact that Christians had higher fertility than Muslims; something most Muslims and Christians today would find a very peculiar worry. In After Tamerlane there is a reference to a racial triumphalist demographer writing in 1900 about the "fact" that in the year 2000 there will be 1.5 billion whites and only 400 million Han Chinese. Finally, variance matters. Note: Germany is something of an oddity in this. In most countries with low fertility, young women have their first child late, and stop at one. In Germany, women with children often have two or three. But many have none at all. Italy and Germany might both have low expectations in regards to the number of children a woman may have in her lifetime, but the shape of the distribution may matter a great deal if fertility is heritable to any extent (straight out of Genetical Theory here). Heritability need not be physiological; rather, it might be cultural and psychological propensities transmitted to the next generation. But if the data above hold one might expect German fertility to bounce back faster than Italian because a subset of the German population exhibit pro-natalist sentiments. (H/T Talk Islam) Labels: Demographics, fertility
Monday, March 03, 2008
My old cyber-friend, "Georg Kantor", has a new English-language blog (his native language is Spanish): Social Equilibrium, which might be of interest to GNXP readers. In particular, check out his demographics tool, introduced on this post, "designed to produce transparent and easy population projections for non-professional users". Labels: Demographics, Modeling |
  Razib's Home Page GNXP Archives Interviews Blogroll Principles of Population Genetics Genetics of Populations Molecular Evolution Quantitative Genetics Evolutionary Quantitative Genetics Evolutionary Genetics Evolution Molecular Markers, Natural History, and Evolution The Genetics of Human Populations Genetics and Analysis of Quantitative Traits Epistasis and Evolutionary Process Evolutionary Human Genetics Biometry Mathematical Models in Biology Speciation Evolutionary Genetics: Case Studies and Concepts Narrow Roads of Gene Land 1 Narrow Roads of Gene Land 2 Narrow Roads of Gene Land 3 Statistical Methods in Molecular Evolution The History and Geography of Human Genes Population Genetics and Microevolutionary Theory Population Genetics, Molecular Evolution, and the Neutral Theory Genetical Theory of Natural Selection Evolution and the Genetics of Populations Genetics and Origins of Species Tempo and Mode in Evolution Causes of Evolution Evolution The Great Human Diasporas Bones, Stones and Molecules Natural Selection and Social Theory Journey of Man Mapping Human History The Seven Daughters of Eve Evolution for Everyone Why Sex Matters Mother Nature Grooming, Gossip, and the Evolution of Language Genome R.A. Fisher, the Life of a Scientist Sewall Wright and Evolutionary Biology Origins of Theoretical Population Genetics A Reason for Everything The Ancestor's Tale Dragon Bone Hill Endless Forms Most Beautiful The Selfish Gene Adaptation and Natural Selection Nature via Nurture The Symbolic Species The Imitation Factor The Red Queen Out of Thin Air Mutants Evolutionary Dynamics The Origin of Species The Descent of Man Age of Abundance The Darwin Wars The Evolutionists The Creationists Of Moths and Men The Language Instinct How We Decide Predictably Irrational The Black Swan Fooled By Randomness Descartes' Baby Religion Explained In Gods We Trust Darwin's Cathedral A Theory of Religion The Meme Machine Synaptic Self The Mating Mind A Separate Creation The Number Sense The 10,000 Year Explosion The Math Gene Explaining Culture Origin and Evolution of Cultures Dawn of Human Culture The Origins of Virtue Prehistory of the Mind The Nurture Assumption The Moral Animal Born That Way No Two Alike Sociobiology Survival of the Prettiest The Blank Slate The g Factor The Origin Of The Mind Unto Others Defenders of the Truth The Cultural Origins of Human Cognition Before the Dawn Behavioral Genetics in the Postgenomic Era The Essential Difference Geography of Thought The Classical World The Fall of the Roman Empire The Fall of Rome History of Rome How Rome Fell The Making of a Christian Aristoracy The Rise of Western Christendom Keepers of the Keys of Heaven A History of the Byzantine State and Society Europe After Rome The Germanization of Early Medieval Christianity The Barbarian Conversion A History of Christianity God's War Infidels Fourth Crusade and the Sack of Constantinople The Sacred Chain Divided by the Faith Europe The Reformation Pursuit of Glory Albion's Seed 1848 Postwar From Plato to Nato China: A New History China in World History Genghis Khan and the Making of the Modern World Children of the Revolution When Baghdad Ruled the Muslim World The Great Arab Conquests After Tamerlane A History of Iran The Horse, the Wheel, and Language A World History Guns, Germs, and Steel The Human Web Plagues and Peoples 1491 A Concise Economic History of the World Power and Plenty A Splendid Exchange Contours of the World Economy 1-2030 AD Knowledge and the Wealth of Nations A Farewell to Alms The Ascent of Money The Great Divergence Clash of Extremes War and Peace and War Historical Dynamics The Age of Lincoln The Great Upheaval What Hath God Wrought Freedom Just Around the Corner Throes of Democracy Grand New Party A Beautiful Math When Genius Failed Catholicism and Freedom American Judaism
Archives
July 2005 August 2005 September 2005 October 2005 November 2005 December 2005 January 2006 February 2006 March 2006 April 2006 May 2006 June 2006 July 2006 August 2006 September 2006 October 2006 November 2006 December 2006 January 2007 February 2007 March 2007 April 2007 May 2007 June 2007 July 2007 August 2007 September 2007 October 2007 November 2007 December 2007 January 2008 February 2008 March 2008 April 2008 May 2008 June 2008 July 2008 August 2008 September 2008 October 2008 November 2008 December 2008 January 2009 February 2009 March 2009 April 2009 May 2009 June 2009 July 2009 August 2009 September 2009 October 2009 November 2009 December 2009 January 2010 February 2010 Hello Movable Type archives August 11,2002 August 18,2002 August 25,2002 September 01,2002 September 15,2002 October 20,2002 December 08,2002 December 22,2002 December 29,2002 January 05,2003 January 12,2003 January 19,2003 January 26,2003 February 02,2003 February 09,2003 February 16,2003 February 23,2003 March 02,2003 March 09,2003 March 16,2003 March 23,2003 March 30,2003 April 06,2003 April 13,2003 April 20,2003 April 27,2003 May 04,2003 May 11,2003 May 18,2003 May 25,2003 June 01,2003 June 08,2003 June 15,2003 June 22,2003 June 29,2003 July 06,2003 July 13,2003 July 20,2003 July 27,2003 August 03,2003 August 10,2003 August 17,2003 August 24,2003 August 31,2003 September 07,2003 September 14,2003 September 21,2003 September 28,2003 October 05,2003 October 12,2003 October 19,2003 October 26,2003 November 02,2003 November 09,2003 November 16,2003 November 23,2003 November 30,2003 December 07,2003 December 14,2003 December 21,2003 December 28,2003 January 04,2004 January 11,2004 January 18,2004 January 25,2004 February 01,2004 February 08,2004 February 15,2004 February 22,2004 February 29,2004 March 07,2004 March 14,2004 March 21,2004 March 28,2004 April 04,2004 April 11,2004 April 18,2004 April 25,2004 May 02,2004 May 09,2004 May 16,2004 May 23,2004 May 30,2004 June 06,2004 June 13,2004 June 20,2004 June 27,2004 July 04,2004 July 11,2004 July 18,2004 July 25,2004 August 01,2004 August 08,2004 August 15,2004 August 22,2004 August 29,2004 September 05,2004 September 12,2004 September 19,2004 September 26,2004 October 03,2004 October 10,2004 October 17,2004 October 24,2004 October 31,2004 November 07,2004 November 14,2004 November 21,2004 November 28,2004 December 05,2004 December 12,2004 December 19,2004 December 26,2004 January 02,2005 January 09,2005 January 16,2005 January 23,2005 January 30,2005 February 06,2005 February 13,2005 February 20,2005 February 27,2005 March 06,2005 March 13,2005 March 20,2005 March 27,2005 April 03,2005 April 10,2005 April 17,2005 April 24,2005 May 01,2005 May 08,2005 May 15,2005 May 22,2005 May 29,2005 June 05,2005 June 12,2005 June 19,2005 June 26,2005 July 03,2005 July 17,2005 August 07,2005 Blogspot archives June 2002 July 2002 August 2002 September 2002 October 2002 November 2002 December 2002
10 questions for....
Parag Khanna James Flynn Jon Entine Gregory Clark György Buzsáki Heather Mac Donald Bruce Lahn A.W.F. Edwards Luigi Luca Cavalli-Sforza Joseph LeDoux Matthew Stewart Charles Murray James F. Crow Adam K. Webb Justin L. Barrett David Haig Judith Rich Harris Ken Miller Dan Sperber Warren Treadgold Armand M. Leroi John Derbyshire
Blogs
The GiveWell Blog Your Religion Is False Colby Cosh Steve Hsu Audacious Epigone Catallaxy Files Inductivist 2 Blowhards Genetic Future Agnostic Steve Sailer Dienekes Derek Lowe Razib Khan Razib at Comment is Free Secular Right Glenn Reynolds Jim Miller Kevin McGrew John Hawks Peter Fost Randall Parker Less Wrong Charles Murray Carl Zimmer EconLog Marginal Revolution
Principles of Population Genetics
Genetics of Populations Molecular Evolution Quantitative Genetics Evolutionary Quantitative Genetics Evolutionary Genetics Evolution Molecular Markers, Natural History, and Evolution The Genetics of Human Populations Genetics and Analysis of Quantitative Traits Epistasis and Evolutionary Process Evolutionary Human Genetics Biometry Mathematical Models in Biology Speciation Evolutionary Genetics: Case Studies and Concepts Narrow Roads of Gene Land 1 Narrow Roads of Gene Land 2 Narrow Roads of Gene Land 3 Statistical Methods in Molecular Evolution The History and Geography of Human Genes Population Genetics and Microevolutionary Theory Population Genetics, Molecular Evolution, and the Neutral Theory Genetical Theory of Natural Selection Evolution and the Genetics of Populations Genetics and Origins of Species Tempo and Mode in Evolution Causes of Evolution Evolution The Great Human Diasporas Bones, Stones and Molecules Natural Selection and Social Theory Journey of Man Mapping Human History The Seven Daughters of Eve Evolution for Everyone Why Sex Matters Mother Nature Grooming, Gossip, and the Evolution of Language Genome R.A. Fisher, the Life of a Scientist Sewall Wright and Evolutionary Biology Origins of Theoretical Population Genetics A Reason for Everything The Ancestor's Tale Dragon Bone Hill Endless Forms Most Beautiful The Selfish Gene Adaptation and Natural Selection Nature via Nurture The Symbolic Species The Imitation Factor The Red Queen Out of Thin Air Mutants Evolutionary Dynamics The Origin of Species The Descent of Man Age of Abundance The Darwin Wars The Evolutionists The Creationists Of Moths and Men The Language Instinct How We Decide Predictably Irrational The Black Swan Fooled By Randomness Descartes' Baby Religion Explained In Gods We Trust Darwin's Cathedral A Theory of Religion The Meme Machine Synaptic Self The Mating Mind A Separate Creation The Number Sense The 10,000 Year Explosion The Math Gene Explaining Culture Origin and Evolution of Cultures Dawn of Human Culture The Origins of Virtue Prehistory of the Mind The Nurture Assumption The Moral Animal Born That Way No Two Alike Sociobiology Survival of the Prettiest The Blank Slate The g Factor The Origin Of The Mind Unto Others Defenders of the Truth The Cultural Origins of Human Cognition Before the Dawn Behavioral Genetics in the Postgenomic Era The Essential Difference Geography of Thought The Classical World The Fall of the Roman Empire The Fall of Rome History of Rome How Rome Fell The Making of a Christian Aristoracy The Rise of Western Christendom Keepers of the Keys of Heaven A History of the Byzantine State and Society Europe After Rome The Germanization of Early Medieval Christianity The Barbarian Conversion A History of Christianity God's War Infidels Fourth Crusade and the Sack of Constantinople The Sacred Chain Divided by the Faith Europe The Reformation Pursuit of Glory Albion's Seed 1848 Postwar From Plato to Nato China: A New History China in World History Genghis Khan and the Making of the Modern World Children of the Revolution When Baghdad Ruled the Muslim World The Great Arab Conquests After Tamerlane A History of Iran The Horse, the Wheel, and Language A World History Guns, Germs, and Steel The Human Web Plagues and Peoples 1491 A Concise Economic History of the World Power and Plenty A Splendid Exchange Contours of the World Economy 1-2030 AD Knowledge and the Wealth of Nations A Farewell to Alms The Ascent of Money The Great Divergence Clash of Extremes War and Peace and War Historical Dynamics The Age of Lincoln The Great Upheaval What Hath God Wrought Freedom Just Around the Corner Throes of Democracy Grand New Party A Beautiful Math When Genius Failed Catholicism and Freedom American Judaism   Policies Terms of use © http://www.gnxp.com Razib's total feed: |