
|
Sunday, July 19, 2009
One of the "theories" I've had for a long time is that the smaller a proportion of a society's population atheists are, the stranger and more deviant they are going to be. A reason I came to this position is that read an account by an atheist American scientist who had some interactions with Soviet religious dissidents during the Cold War. His position was that in many ways American atheists and Soviet religious dissidents exhibited similarities in terms of personality, likely because they were generally not conformists. One of the peculiarities of the massive re-confessionalization of Russian society after the fall of the Soviet Union is the reality that these Communist era dissidents are now being marginalized in many congregations by recent converts who had a background as apparatchiks in the old regime, and were sometimes even actively involved in persecuting their current coreligionists! In any case, what about my hypothesis? Do I have any evidence for it? Not in any substantive manner. So I thought it might be interesting to look in the World Values Survey, naturally. How do attitudes of atheists and religious people vary within a society as a function of the proportion of each group?
I limited the sample to males, because men are more secular on average and exhibit more variance between nations. Additionally, because so many nations have very few atheists I put a lower bound of N = 20 for "convinced atheists." I mollified my own concerns about such a low N with the hope that if an N in a society is that low, the atheists may be strange enough indeed that their deviation from the social median may still swamp the noise. As before, the means for a class were calculated. So, the mean political self position of atheists and the religious is on a 1-10 scale. Below are are the charts for the results of a set of questions which exhibit a 1-10 level of agreement along a spectrum. The position is less important than the difference. First is a simple scatterplot which shows the attitudes of both the religious and atheists by nation. The expectation is a strong correlation between the religious and atheists, because most of the variation is naturally between nations. The second chart shows the difference between the two groups, "Religious persons" and "Convinced Atheists." I excluded those who were "Not religious" from the sample (so those who don't consider themselves religious, but neither are they professed atheists). Lastly, I plotted the difference between atheists and the religious as function of the ratio of religious to atheists. So, for example, the ratio of religious to atheists for Iraq is very high, atheists are a small minority (though to my surprise the N was large enough to stay above the threshold I put). In China the number of convinced atheists and religious are at parity, though those who are without religion and are not atheists are a plural majority. Looking at these results I'm going to withdraw my model. * For the "justifiable" questions 1 = never, 10 = always. * Competition is good = 1, competition is harmful = 10. * 1 = everything determined by fate, 10 = people shape their fates. * 1 = gov. more responsibility, 10 = individual more responsibility. * 1 = incomes more equal, 10 = we need larger differences for incentives. * 1 = private ownership should be increased, gov. ownership should be increased. * 1 = science makes world worse off, 10 = better off. * 1 = Left, 10 = Right.                                                    Labels: data, World Values Survey
Sunday, June 21, 2009
Religious people are breeding, producing more religion....(?)
posted by
Razib @ 6/21/2009 02:12:00 PM
I've pointed to the World Values Survey before. It comes in 5 waves spaced out over 2 decades, and has substantial, if not total, coverage. Additionally, for many non-developed countries the educational data to me suggest some high SES skew in terms of representativeness (though spot checking the American data that looks very representative, as there have been other national surveys you can cross-reference it with). On some of my blogs a few commenters have started to follow up posts and use the WVS to answer questions, instead of offering of speculations. It's not as complicated of an interface as the GSS, but it isn't as flexible either. Nevertheless, there are some obvious questions one might ask.
For example in general within societies the religious have more offspring than the non-religious. Even controlling for variables there is often a significant effect. That implies that over time if religiosity is heritable (whether biologically or culturally) societies should become more religious. So a priori assertions such as Mark Steyn's that Turkish secularism is doomed because the rural religious have outbred the citified secularists seem plausible. The WVS can help us answer this sort of question. For example, if the religious are outbreeding the non-religious and religion is substantially heritable so as to counteract any rate of defection than younger age cohorts should be noticeably more religious, right? Are they in Turkey? I use Turkey as an example to illustrate how useful the WVS can be. So first go to http://www.worldvaluessurvey.org/ I've circled some areas red to click through.  Click the area where I've circled read. You need to jump through some hoops (it uses POST to go from page to page).    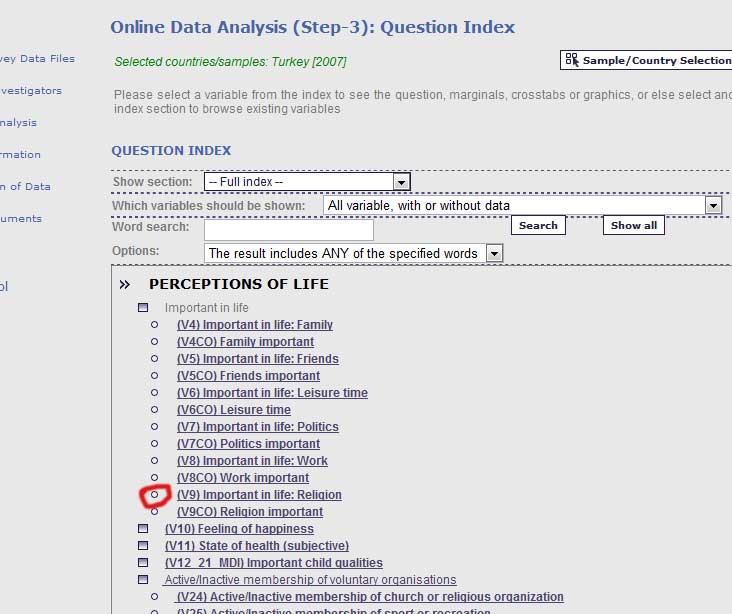 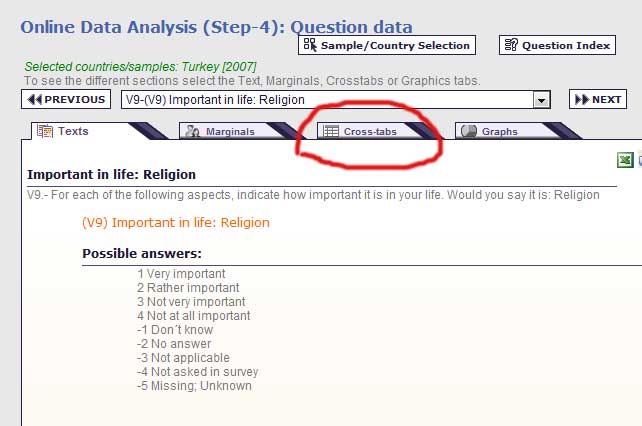 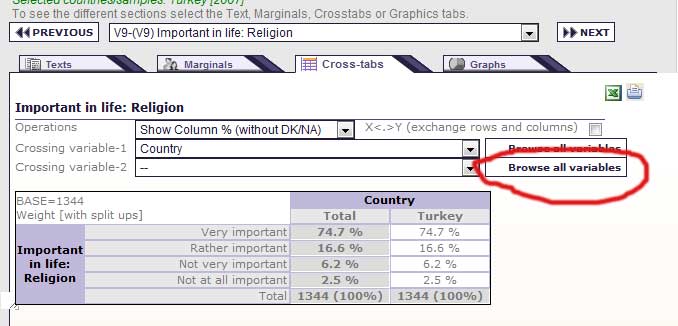 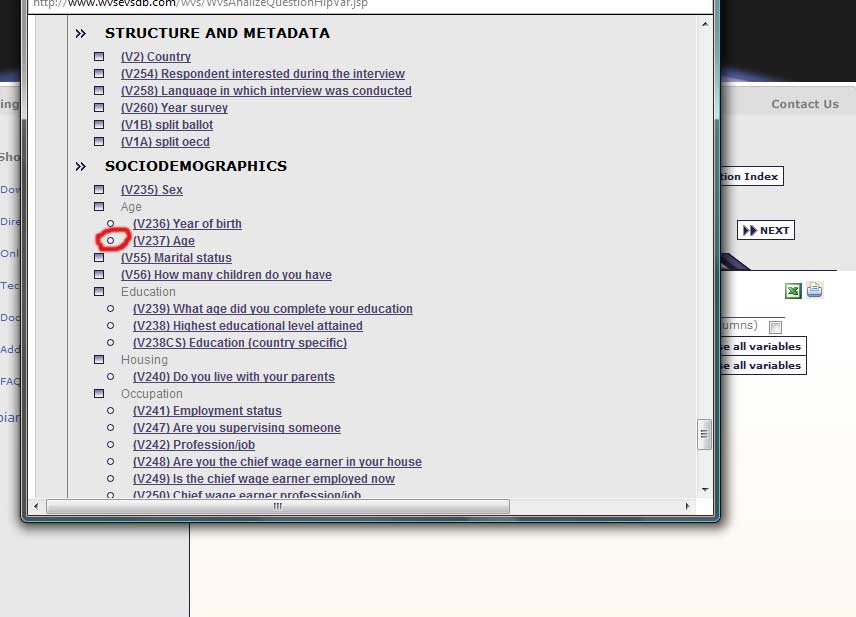  I've broken down the importance of religion as a function of age. There is no trend toward greater religiosity among the young.  I've now broken down by both and age & sex. As in most societies secularism is more pronounced with youth among males.  I went back and looked at another question in regards to the influence of religious leaders on voting. There is no trend of younger people being more supportive of this. There are plenty of other religion & government related questions you can ask. When Steyn made that assertion I made sure to remember to poke around Turkey's WVS results, and they don't seem to support it. The theory is coherent, but the facts do that match. I hope this is a lesson for readers. Theory provides free information. But since there are tools to check inferences one makes from assumptions one should do so before taking theory as a given (all the above took me 3 minutes, excluding screen capture & Photoshop). Labels: Religion, World Values Survey
Wednesday, June 17, 2009
Update: See below....
The World Values Survey has a lot of data broken down by subjective social class. One of these asks how many children an individual has. So I thought it might be of interested to inspect WVS 5, generally taken around 2005, and compare differences by class in term of children. Of course there might be differences in the age breakdowns of the different classes, so that controlling for age there might be greater differences than evident. But as a coarse I thought it would be of interest. Because the data is in proportions I added up the percentage with 3 or more children in class (above replacement). For a few selected nations I calculated the mean for each class (I used WVS 3 and 4 to supplement).* I didn't go into this with any particular hypothesis or expectation, but I'm going to explore particular questions in future posts.... Date below.
Readers with insights about a specific nation (because you actually know something, not rank speculation) are welcome to clarify. I was struck by the differences between Scandinavia and southern Europe. Interestingly, both Chile and Argentina exhibit the southern European pattern. Update: Mean fertility by subjective class isn't too hard to calculate. But the formatting is kind of crappy, so I put the table here. All from WVS 5. Remember that the N's for "Upper Class" are almost always very small, so I'd ignore those. I'm pretty sure that the survey sample for many Third World countries are of higher SES than the population median, so don't get too trusting of the specific numbers, but rather how the rank orders relate to each other up and down the social ladder. Note: CSV file. * I should have calculated the mean for each nation, but it's rather tedious. Labels: World Values Survey
Thursday, June 11, 2009
The World Values Survey Wave 5 has several questions about how much people trust others. In particular, one question asks about religion and another nationality. There are four responses:
-Trust completely -Trust a little -Not trust very much -Not trust at all In the WVS there are proportions for each class for many nations. I took each proportion, and multiplied them by a number where: -Trust completely = 3 -Trust a little = 2 -Not trust very much = 1 -Not trust at all = 0 So that if 100% did not trust at all the number would add to 0, and if 100% trusted complete it would add to 4. Naturally most nations fell in between with a range. I assumed that there would be a strong correlation between the two values. It was very strong, as evidenced by the charts below. 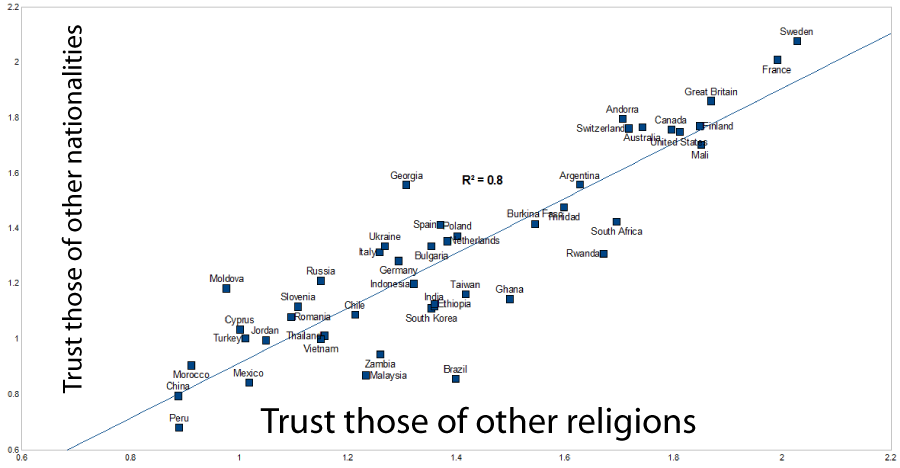 OK, so how does religious trust related to how important people think is in their own lives? Again, there are four categories, from very important to not important at all. Again weighting the proportions so that 4 = very important and 0 = not important at all. So how about religious trust vs. religion important? 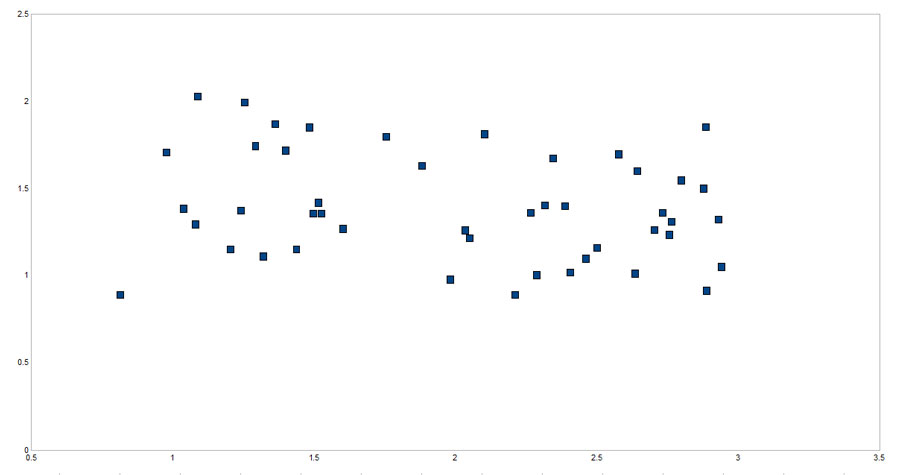 No need to label, there's just no relationship. Weird. I also drilled down for selected nations to see if there was a relationship within the nations in regards to trust (both kinds here) and how important religion was. Not really. In fact, in many nations the least religious trusted those of other religions the least, so it might be expressing a general anti-religious sentiment. As an anecdote I friend whose husband was French one commented how secular French have a distrust of religion in general, and view non-traditional religions with particular distaste, viewing them as cults (non-traditional as in evangelical Protestantism, Hare Krishna, etc.). The raw data....
Labels: World Values Survey
Sunday, June 07, 2009
TGGP has a post up where he looks at attitudes toward polygyny in predominantly Muslim nations. The question is:
To what extent do you agree or disagree with men having more than one wife? Do you strongly agree, agree, disagree, or strongly disagree? I decided to break-down by religion in those nations which had a large non-Muslim population. Results below.
Update: Above I only posted those Muslim nations with large enough religious minorities for there to be comparisons. Here are the frequencies who "strongly agree" + "agree" with men having more than one wife for all the nations: Algeria - 43 Bangladesh - 5.5 Indonesia - 18.7 Iran - 11.5 Iraq - 47.1 Jordan - 18.7 Morocco - 37.5 Nigeria - 39.4 Pakistan - 1.1 Saudi Arabia - 42.1 Turkey - 15.6 Egypt - 10.3 Labels: Religion, World Values Survey
Monday, June 01, 2009
The World Values Survey has a question of the form:
Some people believe that individuals can decide their own destiny, while others think that it is impossible to escape a predetermined fate. Please tell me which comes closest to your view on this scale on which 1 means "everything in life is determined by fate," and 10 means that "people shape their fate themselves." Below the fold are the percentages in selected nations which picked "10," which is basically the least fatalistic position.
Labels: World Values Survey
Tuesday, May 19, 2009
I looked at data from the World Values Survey in terms of the actual proportion of those in the age group 30-49 for various countries who have 2 or fewer children, vs. those in that age group who thought 2 or fewer was the ideal number. I aggregated Wave 3 and Wave 4 surveys, so the times range from 1995 to 2002. Data, etc., below.
Now a chart, here's how you'd read it: Top of the Y axis = low fertility in the 30-49 age group (lots of people with 2 or fewer children) To the right of the X axis = nations with low fertility preferences in the 30-49 age group (lots of people who think 2 or fewer children is the ideal) The line represents X = Y. So nations above the line are those where there is more ideal preference for children than the reality, while nations below the line there is more reality, so to speak, than the ideal.  There seems to be a situation where in many nations people want more children than they are having. That is, their avowed preference is greater than what is revealed by their behavior. There are general clusters. The "breeder nations," where people do have many children, but want even more, and the other set where populations are underperforming even their mild expectations. No surprise that the post-Communist nations are in the second category, but interestingly the East Asian nations of Japan and South Korea fall into this range. Interestingly, these are also nations which tend to be rather secular for their social conservatism from a Western perspective. Georgia is not a typo, though I wouldn't be surprised there was a problem with the data (it might be coded or entered incorrectly). Then there are nations where people have more children than they want. Iran has some specific historical conditions which can explain this. During the Iran-Iraq War the Iranian leadership was pro-natalist, but in its wake they have strongly encouraged family planning. Iran is now a sub-replacement nation when it comes to fertility. Vietnam and India have experienced economic turnarounds of late due to their relatively late entrance into the game of globalization. These surveys occurred around the year 2000, about 10 years into both of their liberalization programs. One might be seeing the outcomes of earlier norms overlain upon new mores due to international media. Finally, as far as Bangladesh goes, it is an ethnically and religiously homogeneous nation, so there isn't a national imperative whereby ethnic groups worry about other groups outbreeding them. Additionally, it is very, very, crowded. There are many poor African nations, but aside from Rwanda and Burundi, all of them are far below the Malthusian parameters when it comes to primary production in relation to Bangladesh. Labels: culture, World Values Survey
Sunday, May 03, 2009
Below when I compared the Nordic countries and Italy on a host of variables, I noted in the comments that it was rather amusing that 99% of the people in Bangladesh asserted that bribery was never justifiable, while only 69% of Swedes did. More specifically, the World Values Survey simply asked if bribery was ever justifiable, and there 10 options, with 0 = never justifiable and 10 = always justifiable. So 99% of the Bangladeshis chose 0, while only 69% of Swedes did. Plotting the 2008 Corruptions Perceptions Index scores from Transparency International against the proportion who chose 0, bribery is never justifiable, resulted in this:
 Here's the raw data:
Eastern Europeans and Filipinos are at least honest about their "pragmatism." Labels: culture, data, World Values Survey
Friday, May 01, 2009
Over the years several Finnish readers (OK, one specific Finnish reader) has made the repeated claim that some of the stereotypes that Americans have of politically correct (Fenno)-Scandinavians is actually typical of Sweden, and not Finland, or even the other Nordic countries. As I've been poking around The World Values Survey I think there is something to this. There are some sets of questions where the Swedes give much more "Politically Correct" answers than Finns, or even other Nordics. I note that the answers are Politically Correct because I'm not necessarily saying that the answers someone gives on a survey necessarily translates into the same magnitude of public policy difference. The World Values Survey happens to have Denmark, Sweden and Finland (at least the Four-wave Aggregate of the Values Studies which I'm using). I decided to post responses to a large range of questions (obviously a finite set) for these three nations, as well as Italy as European outgroup. Many of the responses were as you would expect; the Nordic countries are more openly secular than Italy. The fact that Italians were more hostile to the idea of living next to large families also was not surprising, at least judging from what I've heard of how they view the French as breeders. On the other hand, there are a host of questions where Sweden is the outgroup, and another set where Sweden and Denmark are relatively close, with Finland approaching Italy in social outlooks. Finally, many of the results reinforce an interesting point that was clear when I looked at Hong Kong: socialist nations often exhibit some fatigue at the extent of the nanny state, while nations with thinner social safety nets have a more positive attitude toward future extension of the welfare state. Since the results below are a finite subset I invite readers to go in and explore The World Values Survey themselves.
Note: Sample sizes are around 1,000 for each nation. Additionally the surveys were done in 1999 to 2001.
Labels: Finn baiting, Nordics, World Values Survey
Sunday, April 26, 2009
Over at ScienceBlogs I have a post which highlights the bizarre likelihood that in China atheists are actually some more hostile to the precepts of godless Communism than the religious. I talked to Michael Vassar about this and he thought it was curious that Chinese atheists are probably among the segments of the world population most likely to appreciate the non-zero sum power of capitalism and economic growth. Well, I guess Mao and the Cultural Revolution would do that to you, right? In any case, in the World Values Survey there is a question about income inequality, here 0 = Incomes Should Be Made More Equal, and 10 = We need larger income differences as incentives. Below the fold are a selection of nations with the proportions of those in the 15-29 age ranges who agree with a "10" when it comes to income inequality.
Hong Kong, by the way, had the population which was most averse to income inequality.... Labels: Economics, World Values Survey
Tuesday, April 14, 2009
It turns out that the World Values Survey has a decent web interface, rather like the GSS. As an exercise I thought I would compare 4 nations when it came to religious attitudes, the United States, Sweden, South Korea and Japan. The United States because most readers are American. Sweden because it is the apotheosis of European secularity. Japan because it is generally presumed to be an apathetic non-Western nation when it comes to religion. And South Korea, which sends more Christianity missionaries than any nation aside from the United States. The data for South Korea are usually a revelation for Americans, as we are conditioned by the dominant role of conservative Protestantism among our own ethnic Korean population, it is somewhat of a surprise when digging into the data to note that Korea is a much more secular nation than the United States.
The data are open to many interpretations. You can actually do more fine-grained analysis, but I'll leave that for the readers. I would say: 1) South Koreans are more religious than the Japanese, but also just as starkly they are more polarized. Look at the first table and how many Koreans asserted that they were convinced atheists, as opposed to the more mellow Japanese and Swedes. Japan and Sweden are clearly more secular than South Korea, but since religious controversy isn't a feature of their public life, atheism vs. theism is less of an issue. 2) From a Western perspective the American & Swedish data are rather easy to interpret. The high rates of Swedish affiliation despite their secularity is simply due to the history of the established Lutheran church in that nation (only recently disestablished last I checked), and the customary attachment which most Swedes have to the institution. Aside from that, Sweden is secular and the United States not so much. South Korea and Japan are harder to interpret. Despite being very secular Japan is obviously rather conservative when it comes to many social mores, and Korea exhibits the same tendency. Rather than pinning down a specific explanation it is important to note that the role of institutional organized religion has been relatively marginal in these two societies until recently, and what role it did play was of low prestige compared to that in Western societies. In fact it can be argued that South Korea is simultaneously becoming a more religious and liberal society. 3) Despite the fact that Sweden has high rates of nominal affiliation to the Lutheran church, ceremonial and ritual religion seems to be a more common feature of the lives of the Japanese. Labels: Religion, World Values Survey |
  Razib's Home Page GNXP Archives Interviews Blogroll Principles of Population Genetics Genetics of Populations Molecular Evolution Quantitative Genetics Evolutionary Quantitative Genetics Evolutionary Genetics Evolution Molecular Markers, Natural History, and Evolution The Genetics of Human Populations Genetics and Analysis of Quantitative Traits Epistasis and Evolutionary Process Evolutionary Human Genetics Biometry Mathematical Models in Biology Speciation Evolutionary Genetics: Case Studies and Concepts Narrow Roads of Gene Land 1 Narrow Roads of Gene Land 2 Narrow Roads of Gene Land 3 Statistical Methods in Molecular Evolution The History and Geography of Human Genes Population Genetics and Microevolutionary Theory Population Genetics, Molecular Evolution, and the Neutral Theory Genetical Theory of Natural Selection Evolution and the Genetics of Populations Genetics and Origins of Species Tempo and Mode in Evolution Causes of Evolution Evolution The Great Human Diasporas Bones, Stones and Molecules Natural Selection and Social Theory Journey of Man Mapping Human History The Seven Daughters of Eve Evolution for Everyone Why Sex Matters Mother Nature Grooming, Gossip, and the Evolution of Language Genome R.A. Fisher, the Life of a Scientist Sewall Wright and Evolutionary Biology Origins of Theoretical Population Genetics A Reason for Everything The Ancestor's Tale Dragon Bone Hill Endless Forms Most Beautiful The Selfish Gene Adaptation and Natural Selection Nature via Nurture The Symbolic Species The Imitation Factor The Red Queen Out of Thin Air Mutants Evolutionary Dynamics The Origin of Species The Descent of Man Age of Abundance The Darwin Wars The Evolutionists The Creationists Of Moths and Men The Language Instinct How We Decide Predictably Irrational The Black Swan Fooled By Randomness Descartes' Baby Religion Explained In Gods We Trust Darwin's Cathedral A Theory of Religion The Meme Machine Synaptic Self The Mating Mind A Separate Creation The Number Sense The 10,000 Year Explosion The Math Gene Explaining Culture Origin and Evolution of Cultures Dawn of Human Culture The Origins of Virtue Prehistory of the Mind The Nurture Assumption The Moral Animal Born That Way No Two Alike Sociobiology Survival of the Prettiest The Blank Slate The g Factor The Origin Of The Mind Unto Others Defenders of the Truth The Cultural Origins of Human Cognition Before the Dawn Behavioral Genetics in the Postgenomic Era The Essential Difference Geography of Thought The Classical World The Fall of the Roman Empire The Fall of Rome History of Rome How Rome Fell The Making of a Christian Aristoracy The Rise of Western Christendom Keepers of the Keys of Heaven A History of the Byzantine State and Society Europe After Rome The Germanization of Early Medieval Christianity The Barbarian Conversion A History of Christianity God's War Infidels Fourth Crusade and the Sack of Constantinople The Sacred Chain Divided by the Faith Europe The Reformation Pursuit of Glory Albion's Seed 1848 Postwar From Plato to Nato China: A New History China in World History Genghis Khan and the Making of the Modern World Children of the Revolution When Baghdad Ruled the Muslim World The Great Arab Conquests After Tamerlane A History of Iran The Horse, the Wheel, and Language A World History Guns, Germs, and Steel The Human Web Plagues and Peoples 1491 A Concise Economic History of the World Power and Plenty A Splendid Exchange Contours of the World Economy 1-2030 AD Knowledge and the Wealth of Nations A Farewell to Alms The Ascent of Money The Great Divergence Clash of Extremes War and Peace and War Historical Dynamics The Age of Lincoln The Great Upheaval What Hath God Wrought Freedom Just Around the Corner Throes of Democracy Grand New Party A Beautiful Math When Genius Failed Catholicism and Freedom American Judaism
Archives
July 2005 August 2005 September 2005 October 2005 November 2005 December 2005 January 2006 February 2006 March 2006 April 2006 May 2006 June 2006 July 2006 August 2006 September 2006 October 2006 November 2006 December 2006 January 2007 February 2007 March 2007 April 2007 May 2007 June 2007 July 2007 August 2007 September 2007 October 2007 November 2007 December 2007 January 2008 February 2008 March 2008 April 2008 May 2008 June 2008 July 2008 August 2008 September 2008 October 2008 November 2008 December 2008 January 2009 February 2009 March 2009 April 2009 May 2009 June 2009 July 2009 August 2009 September 2009 October 2009 November 2009 December 2009 January 2010 February 2010 Hello Movable Type archives August 11,2002 August 18,2002 August 25,2002 September 01,2002 September 15,2002 October 20,2002 December 08,2002 December 22,2002 December 29,2002 January 05,2003 January 12,2003 January 19,2003 January 26,2003 February 02,2003 February 09,2003 February 16,2003 February 23,2003 March 02,2003 March 09,2003 March 16,2003 March 23,2003 March 30,2003 April 06,2003 April 13,2003 April 20,2003 April 27,2003 May 04,2003 May 11,2003 May 18,2003 May 25,2003 June 01,2003 June 08,2003 June 15,2003 June 22,2003 June 29,2003 July 06,2003 July 13,2003 July 20,2003 July 27,2003 August 03,2003 August 10,2003 August 17,2003 August 24,2003 August 31,2003 September 07,2003 September 14,2003 September 21,2003 September 28,2003 October 05,2003 October 12,2003 October 19,2003 October 26,2003 November 02,2003 November 09,2003 November 16,2003 November 23,2003 November 30,2003 December 07,2003 December 14,2003 December 21,2003 December 28,2003 January 04,2004 January 11,2004 January 18,2004 January 25,2004 February 01,2004 February 08,2004 February 15,2004 February 22,2004 February 29,2004 March 07,2004 March 14,2004 March 21,2004 March 28,2004 April 04,2004 April 11,2004 April 18,2004 April 25,2004 May 02,2004 May 09,2004 May 16,2004 May 23,2004 May 30,2004 June 06,2004 June 13,2004 June 20,2004 June 27,2004 July 04,2004 July 11,2004 July 18,2004 July 25,2004 August 01,2004 August 08,2004 August 15,2004 August 22,2004 August 29,2004 September 05,2004 September 12,2004 September 19,2004 September 26,2004 October 03,2004 October 10,2004 October 17,2004 October 24,2004 October 31,2004 November 07,2004 November 14,2004 November 21,2004 November 28,2004 December 05,2004 December 12,2004 December 19,2004 December 26,2004 January 02,2005 January 09,2005 January 16,2005 January 23,2005 January 30,2005 February 06,2005 February 13,2005 February 20,2005 February 27,2005 March 06,2005 March 13,2005 March 20,2005 March 27,2005 April 03,2005 April 10,2005 April 17,2005 April 24,2005 May 01,2005 May 08,2005 May 15,2005 May 22,2005 May 29,2005 June 05,2005 June 12,2005 June 19,2005 June 26,2005 July 03,2005 July 17,2005 August 07,2005 Blogspot archives June 2002 July 2002 August 2002 September 2002 October 2002 November 2002 December 2002
10 questions for....
Parag Khanna James Flynn Jon Entine Gregory Clark György Buzsáki Heather Mac Donald Bruce Lahn A.W.F. Edwards Luigi Luca Cavalli-Sforza Joseph LeDoux Matthew Stewart Charles Murray James F. Crow Adam K. Webb Justin L. Barrett David Haig Judith Rich Harris Ken Miller Dan Sperber Warren Treadgold Armand M. Leroi John Derbyshire
Blogs
The GiveWell Blog Your Religion Is False Colby Cosh Steve Hsu Audacious Epigone Catallaxy Files Inductivist 2 Blowhards Genetic Future Agnostic Steve Sailer Dienekes Derek Lowe Razib Khan Razib at Comment is Free Secular Right Glenn Reynolds Jim Miller Kevin McGrew John Hawks Peter Fost Randall Parker Less Wrong Charles Murray Carl Zimmer EconLog Marginal Revolution
Principles of Population Genetics
Genetics of Populations Molecular Evolution Quantitative Genetics Evolutionary Quantitative Genetics Evolutionary Genetics Evolution Molecular Markers, Natural History, and Evolution The Genetics of Human Populations Genetics and Analysis of Quantitative Traits Epistasis and Evolutionary Process Evolutionary Human Genetics Biometry Mathematical Models in Biology Speciation Evolutionary Genetics: Case Studies and Concepts Narrow Roads of Gene Land 1 Narrow Roads of Gene Land 2 Narrow Roads of Gene Land 3 Statistical Methods in Molecular Evolution The History and Geography of Human Genes Population Genetics and Microevolutionary Theory Population Genetics, Molecular Evolution, and the Neutral Theory Genetical Theory of Natural Selection Evolution and the Genetics of Populations Genetics and Origins of Species Tempo and Mode in Evolution Causes of Evolution Evolution The Great Human Diasporas Bones, Stones and Molecules Natural Selection and Social Theory Journey of Man Mapping Human History The Seven Daughters of Eve Evolution for Everyone Why Sex Matters Mother Nature Grooming, Gossip, and the Evolution of Language Genome R.A. Fisher, the Life of a Scientist Sewall Wright and Evolutionary Biology Origins of Theoretical Population Genetics A Reason for Everything The Ancestor's Tale Dragon Bone Hill Endless Forms Most Beautiful The Selfish Gene Adaptation and Natural Selection Nature via Nurture The Symbolic Species The Imitation Factor The Red Queen Out of Thin Air Mutants Evolutionary Dynamics The Origin of Species The Descent of Man Age of Abundance The Darwin Wars The Evolutionists The Creationists Of Moths and Men The Language Instinct How We Decide Predictably Irrational The Black Swan Fooled By Randomness Descartes' Baby Religion Explained In Gods We Trust Darwin's Cathedral A Theory of Religion The Meme Machine Synaptic Self The Mating Mind A Separate Creation The Number Sense The 10,000 Year Explosion The Math Gene Explaining Culture Origin and Evolution of Cultures Dawn of Human Culture The Origins of Virtue Prehistory of the Mind The Nurture Assumption The Moral Animal Born That Way No Two Alike Sociobiology Survival of the Prettiest The Blank Slate The g Factor The Origin Of The Mind Unto Others Defenders of the Truth The Cultural Origins of Human Cognition Before the Dawn Behavioral Genetics in the Postgenomic Era The Essential Difference Geography of Thought The Classical World The Fall of the Roman Empire The Fall of Rome History of Rome How Rome Fell The Making of a Christian Aristoracy The Rise of Western Christendom Keepers of the Keys of Heaven A History of the Byzantine State and Society Europe After Rome The Germanization of Early Medieval Christianity The Barbarian Conversion A History of Christianity God's War Infidels Fourth Crusade and the Sack of Constantinople The Sacred Chain Divided by the Faith Europe The Reformation Pursuit of Glory Albion's Seed 1848 Postwar From Plato to Nato China: A New History China in World History Genghis Khan and the Making of the Modern World Children of the Revolution When Baghdad Ruled the Muslim World The Great Arab Conquests After Tamerlane A History of Iran The Horse, the Wheel, and Language A World History Guns, Germs, and Steel The Human Web Plagues and Peoples 1491 A Concise Economic History of the World Power and Plenty A Splendid Exchange Contours of the World Economy 1-2030 AD Knowledge and the Wealth of Nations A Farewell to Alms The Ascent of Money The Great Divergence Clash of Extremes War and Peace and War Historical Dynamics The Age of Lincoln The Great Upheaval What Hath God Wrought Freedom Just Around the Corner Throes of Democracy Grand New Party A Beautiful Math When Genius Failed Catholicism and Freedom American Judaism   Policies Terms of use © http://www.gnxp.com Razib's total feed: |
||||||||||||||||||||||||||||||||||||||||||||||||||||||||||||||||||||||||||||||||||||||||||||||||||||||||||||||||||||||||||||||||||||||||||||||||||||||||||||||||||||||||||||||||||||||||||||||||||||||||||||||||||||||||||||||||||||||||||||||||||||||||||||||||||||||||||||||||||||||||||||||||||||||||||||||||||||||||||||||||||||||||||||||||||||||||||||||||||||||||||||||||||||||||||||||||||||||||||||||||||||||||||||||||||||||||||||||||||||||||||||||||||||||||||||||||||||||||||||||||||||||||||||||||||||||||||||||||||||||||||||||||||||||||||||||||||||||||||||||||||||||||||||||||||||||||||||||||||||||||||||||||||||||||||||||||||||||||||||||||||||||||||||||||||||||||||||||||||||||||||||||||||||||||||||||||||||||||||||||||||||||||||||||||||||||||||||||||||||||||||||||||||||||||||||||||||||||||||||||||||||||||||||||||||||||||||||||||||||||||||||||||||||||||||||||||||||||||||||||||||||||||||||||||||||||||||||||||||||||||||||||||||||||||||||||||||||||||||||||||||||||||||||||||||||||||||||||||||||||