
|
Monday, November 23, 2009
About year ago I thought perhaps more bloggers would start taking up the GSS. That really hasn't happened. Sometimes I wonder why, and the other day I had one idea: it isn't necessary for what most bloggers want to do, confirm what they already believe. Google is sufficient. The GSS can be massaged pretty easily. I try and be careful about how I limit the variables so that I don't get the results I "want," bad sign if you keep fiddling & fiddling. That sort of thing made me realize it wouldn't be that hard to squeeze some results you wanted out of the data (though there's no way you're going to get some correlations and trends of course). But why bother? With a sufficiently precise Google query you can get all the data & results you want from the top of the stack which supports your own thesis (it is often not too difficult to reproduce the queries of commenters who engage in this sort of thing to prove their point, just put in a few variants of queries and the link that they provided shows up on the first page of results).
Labels: GSS
Sunday, November 01, 2009
One hypothesis I have held is that there is a cultural gap in the United States whereby the West Coast and the Northeast are more "European" than the rest of the nation. So you have ideas crop up like Jesusland. I decided to see if I could compare European nations and American subregions using the WVS, Eurobarometer and GSS. I looked at two issues:
1) Belief in God 2) Nationalism These two had equivalent questions in the 2000s for the WVS & GSS. I created an index of religiosity whereby: Atheists & agnostic = 0 Higher Power = 1 Theist = 2 And: Very Proud of Country = 3 Somewhat Proud of Country = 2 Not Very Proud = 1 Not Proud at All = 0   On these two traits I don't see much of a Blue America + Europe clade.... Note: Limited GSS results to the 2000s.
Thursday, October 08, 2009
A comment on the post below made me wonder about fertility differences between urban and rural areas of the United States today. I used the GSS variables "childs" and "srcbelt" (the latter recoded a bit), and limited to whites age 40 and over between 1996-2006. Chart of distributions & means below
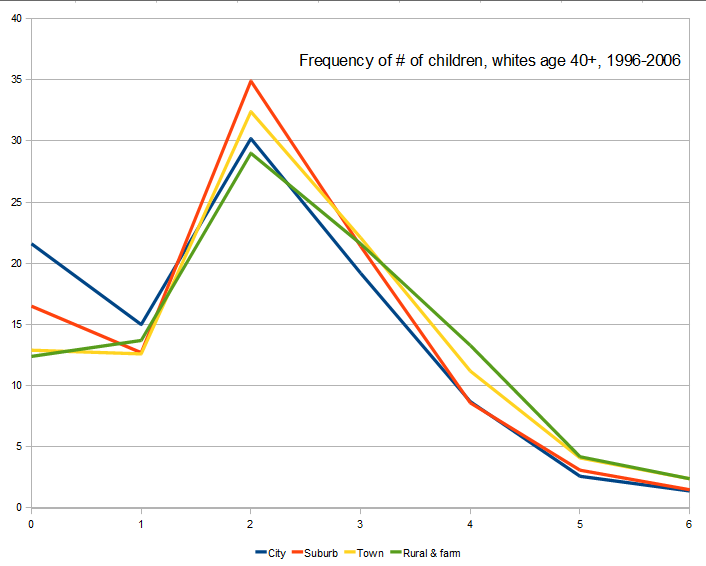
Seems like cultural clustering. I disaggregated in the means to show how the super-cities are somewhat different; New York is a different beast from Minneapolis I assume when it comes to cost of living. One thing to note of course is that many people who are suburbanites at 45 are likely urbanites at 25 and suburbanites at 15, and so forth. It it interesting that suburbanites and urbanites converge at around 4 children, while those in rural and small town locales have a higher frequency of very large families. This is probably reflecting that "2 child norm" is stronger in urban and suburban areas where college degree holders predominate. Labels: GSS
Wednesday, August 26, 2009
The Audacious Epigone has a post up where he queries the GSS to see what proportion of which European ethnic groups has had one lifetime sexual partner.
Labels: GSS
Friday, August 07, 2009
It seems looking at the GSS that:
1) The more secularized a population segment is, the bigger the sex difference in beliefs. This is in keeping with Bryan Caplan's thesis that males become more secular once social and institutional pressures are relaxed to a greater extent than females. 2) Among the segment of the population which is rather religious to begin with (which includes more women than men) males & females are in accord in terms of beliefs. Labels: GSS
Wednesday, May 27, 2009
Your Lying Eyes looks in the GSS to resolve the question above. Looking in the GSS is obviously a mitzvah in my book, as John noted in The Corner today. 6 months ago Kevin Drum promised some GSS blogging in the future, but doesn't look like he's gotten around to it. In any case I asserted below that the human mind is a slapdash ad hoc rationalization generating machine. Since human behavior is in large part a function of the human mind, the same applies to it. This is why I love the GSS; deducing likely sociological patterns from a priori assumptions and facts is not impossible, but it's a real dicey proposition. The empirical data is essential to double-check inferences which seem plausible. And of course, deduction relies on that sneaky prefrontal cortext again, which is liable to play shell games with "logic" until it gets the conclusion it wants. The difference between possible and plausible in the minds of most maps onto normative frameworks rather suspiciously from what I can tell. You can play games with the GSS too by manipulating the interpretation (ignoring obvious confounds), but since the methodology is relatively transparent it's harder to get away with it if you aren't preaching to the choir.
Addendum: Poking through the GSS is actually very easy and doesn't take much time when compared to spinning theories based on personal intuition. So why is the latter still so much more popular than the former? Because theories derived from intuition are easy to verify via personal "thought experiments" or experience. In fact, these experiments always support the theory and rarely falsify them! Labels: GSS
Tuesday, December 09, 2008
At Secular Right I stated:
Right now only a few weblogs (that I know of!) seem to make regular recourse to the GSS when confronted with a question amenable to inquiry. The Inductivist, The Audacious Epigone and to a lesser extent Half Sigma. I wish there were more weblogs out there where individuals would take 10 minutes out of their day to double-check their intuitions (on occasion my co-bloggers at GNXP also do GSS data analysis). So with that in mind, if you are inclined to start blogging GSS data, email me at contactgnxp - at - gmail - dot - com. I will add your blog to the blogrolls of both my Gene Expression weblogs, which should give you some Google Pagerank juice. If your posts are topical to the material of Secular Right I would also be inclined to like to you from posts on this weblog. I'll go further, if a few of these blogs pop up, or come to my attention, I'll do link roundups to try and drive traffic. I might also look into setting up an aggregator site. Labels: GSS
Tuesday, November 18, 2008
I noticed today that Heather Mac Donald has just engaged in another dialog with Michael Novak about God over at Beliefnet. As an unabashed vocal unbeliever Heather is exceptional on the American Right (compare to George F. Will's relative diffidence about his agnosticism). Simultaneously, there has been some concern that the youth vote swung so decisively toward the Democrats this election. Since it is also known that the young people are more secular than past generations, I wonder if some of the shift might not simply be due to the stronger association between American conservatism and a specific religious tradition (conservative Protestantism). Below the fold are tables which I generated using the GSS. I combined ages and political ideologies to simplify the categories (e.g., adding extremely and slightly liberal together with liberal into one category). Also, I filtered the sample so that all respondents were white.
I am struck by the decline in self-identified conservatives who are not 100% sure that God exists. Below is a chart showing the change in the proportion of more secular sectors. I simply added all the categories except for the two most religious ones. 
Tuesday, October 14, 2008
 This chart shows the proportion of white men and women age 50 and over who have 0, 1, 2, etc. children, up to 7. I got this from the GSS via CHILDS. I dropped 8 or more since that's unbounded, but very few had that many (on the order of 1%). Red is female, and navy male. This chart shows the proportion of white men and women age 50 and over who have 0, 1, 2, etc. children, up to 7. I got this from the GSS via CHILDS. I dropped 8 or more since that's unbounded, but very few had that many (on the order of 1%). Red is female, and navy male.
Monday, September 22, 2008
Recently Charles Murray has promoted the idea that too many people are seeking 4 year degrees: "Let's stop this business of the B.A., this meaningless credential". Last year he wrote in the Wall Street Journal:
If you want to do well [in college], you should have an IQ of 115 or higher. Put another way, it makes sense for only about 15% of the population, 25% if one stretches it, to get a college education. And yet more than ... 40% of all persons in their late teens are trying to go to a four-year college--enough people to absorb everyone down through an IQ of 104. Several months ago, the Inductivist found this to be a canny estimate: in the 1960s the average college graduate had an IQ very close to 115, and today the average college graduate has an IQ of 105. But what does this mean for the individual? Murray suggests that college debt, lack of relevant job training, and years of lost workforce wages and experience await those below the 85th percentile: They are in college to improve their chances of making a good living ... and would do better in vocational training ... two-year colleges ... [are] about right for learning many technical specialties, while four years is unnecessarily long ... Finding a good lawyer or physician is easy. Finding a good carpenter, painter, electrician, plumber, glazier, mason--the list goes on and on--is difficult, and it is a seller's market. Journeymen craftsmen routinely make incomes in the top half of the income distribution while master craftsmen can make six figures. I find the thinking here plausible, and these seem like testable enough ideas. Luckily, all the relevant variables are included in the General Social Survey. It's graph day on gnxp. The x axis in the figure below represents the number of correct answers on the 10 question WORDSUM mini IQ test included in the GSS. The y axis represents the respondent's income in constant dollars. The colored lines represent five educational categories, and one occupational category. Moving left to right we see the average income of people in each category as their IQ score increases from 0-10 correct answers. 'Junior college' represents the two-year vocational degree Murray references. And 'Craft and Trade Workers' covers over 50 skilled trade categories like electrician, mason, plumber, carpenter, and mechanic, coded by the survey. 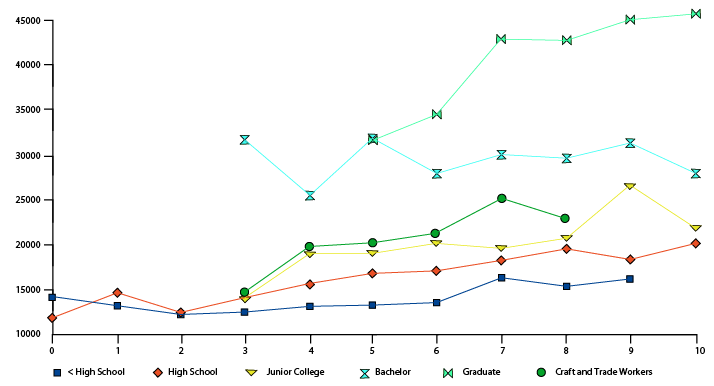 The first observation here is that educational degrees, whether they confer skills or credentials, are more important to income than IQ when minimum thresholds are met. Trade workers, and 2 and 4-year college graduates are not significantly represented in the lowest three IQ categories. Graduate holders have an even higher minimum IQ. Second, income rises within 5 of the 6 categories as IQ increases. Higher IQ generates the biggest pay-off differences between those with advanced degrees, which is consistent with IQ increasing in importance as jobs become more complex. Third, merely earning a Bachelor's degree is a golden ticket. People with average and below average IQs are getting just as much of a financial return out of their 4-year degree as those above the 85th percentile. This suggests many more people of marginal ability should be seeking a Bachelor's degree, not less. Fourth, the two lines for junior college and trade occupations overlap substantially, as we would expect if most people in trade occupations went to trade school. Fifth, and most directly related to Murray's argument, people with 4-year degrees earn much more than people with 2-year degrees and trade jobs at every level of IQ. Average IQ people will get a much, much larger monetary reward from completing a 4 year school than a 2 year school. So the BA is far from being a "meaningless credential" when it comes to "chances of making a good living". It's possible people with average IQs who complete college are exceptional in other ways. But there is no other empirical evidence that vocational school is better at generating income for those <85th percentile. Also, secular trends could distort data in the first graph, which combines all survey data from 1972-2006. So the second graph below represents only people who were 35 and older and surveyed between 2000-2006. Fortunately, the results are not too different from the first graph. The IQ categories are condensed and transformed, and we see that 96 is about the minimum to complete 2 and 4 year college, and 111 the minimum for graduate degrees. Again we find that IQ shows no relationship to income for those with a BA, and, in fact, those with lower IQs might profit the most. For those without advanced degrees, people who are moderately above and moderately below average intelligence might earn the most (this balance might be because other socially valued personality traits, like masculinity, are inversely associated with IQ). 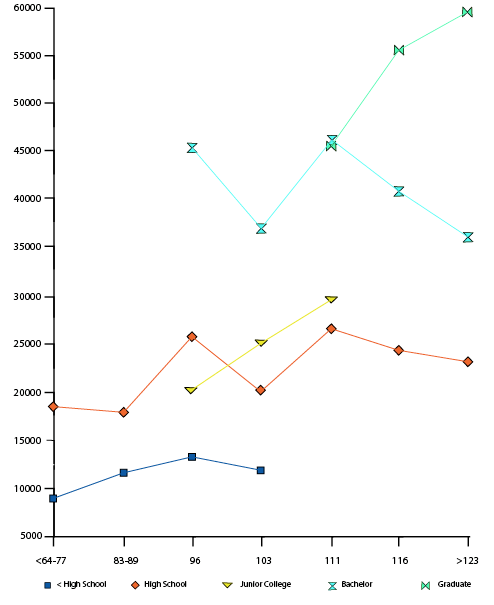 So, while I have yet to read Real Education -- which may address these issues -- it would appear that Murray is mistaken in some of his crucial premises. Still undetermined is if people with 4 year degrees earn a lot more money because they actually acquire important skills, or if inefficient laws/taboos against employee IQ testing, sustain a comically messy and tragically expensive employment screening method. If the latter was true Murray could still be partially correct: 4 year college could be worthless for the <85th percentile, if employers began to use 20 minutes of psychometric testing, instead of 4 year degrees, as their screening filter. But, ceteris paribus, college is still the best pay-off.
Thursday, August 14, 2008
A rumor I've been hearing a lot lately, although I recall hearing it as early as 2003, is that "porn is becoming / has become mainstream" -- or that it's ubiquitous, unavoidable, the wallpaper of our culture. Like most alarmist ideas spread by the innumerate -- failing schools, oral sex rampant among teenagers, the coming Islamic Caliphate -- I assume it is a gross exaggeration or false. And as always, I'm right. It doesn't take a genius: simply judge based on the track record of similar panics made possible by mass media, going back to the witch hysterias of Early Modern Europe.
I collected a bunch of data about a month ago and planned on doing some time series analysis, maybe showing how certain models (like epidemics or logistic growth) would fit the data, but the fall semester begins soon, and I'm preparing enough as it is. So nuts to the analysis; I'll just present the data, since the picture is very clear. In brief, the popularity of pornographic movies has remained steady for over 20 years, and in a sense for the last 35 years -- when the data begin. The popularity of print pornography fell sharply after its peak in the early/mid 1970s and has more slowly declined for about the past 20 years. Even non-pornographic but racy "lad mags" have seen their popularity tank, with only Maxim US holding steady. Before getting to the data, though, how far back does the "porn has become mainstream" meme go? I didn't conduct an exhaustive search, but I found a 1990 letter-to-the-editor in the NYT, as well as a 1998 news story in Time, so it's hardly new. It's interesting to note that most such articles feature a quote like this one from New York Magazine in 2003: Over beers recently, a 26-year-old businessman friend shocked me by casually remarking, "Dude, all of my friends are so obsessed with Internet porn that they can't sleep with their girlfriends unless they act like porn stars." The grave implication is: "Just think of what young people who grow up with this will expect!" But a moment's reflection tells us that the same is true of men who visit prostitutes, who've been around forever. And yet men haven't come to expect their wives to behave like wild whores inside or outside the bedroom -- again, except for the handful of 20-something losers who New York Magazine manages to mine such embarrassing quotes from. Indeed, the universal Madonna / Whore dichotomy tells us that most men will continue to prefer their flings to act like call girls, pornstars, strippers, etc., while preferring their gfs and wives to act not whorish. Enough gasbaggery; onto the data (and then more hot air). The "porn is everywhere" meme claims that a high percentage of people are infected by porn, whether through video or print. Obviously the claim is not that there's a lot of porn out there, but which no one ever consumes -- so we just look at the prevalence of porn-watchers over time. Fortunately, the General Social Survey, a large and representative national survey, asks Americans if they've watched an X-rated movie in the past year. To see for yourself, go here and type in, without quotes, "xmovie" in the row box and "year" in the column box. If you want to see male vs. female, type "sex(1)" for male or "sex(2)" for female into the selection filter box. Across the years, the response rate is 58%, from about 51,000 people -- damn good for surveys. Here are the results for men and women (click on the image to see it full-size):  For men, porn-watching declined at least from 1973 until 1980, and increased until 1987. After that, you may be able to see fluctuations up and down but they're around a pretty steady value of about 35%. The pattern for women is much clearer to see: essentially no trend, but cycles of varying period and amplitude. I interpret these patterns as a decline during the 1970s when porn theaters became unfashionable, an increase during the 1980s as porn became available on VHS, and no change afterward -- in particular, no skyrocket due to the availability of internet porn, something I would not have predicted by intuition. Also bear in mind that if porn were indeed "becoming more mainstream," we should see a strong upward trend just because people are less embarrassed to admit they watch it. Only if people in the 1970s were hooked up to porn 24 hours a day but denying it, while people today admit to it at the same rate but are watching less, would we observe a lack of a strong upward trend. Even in that case, that means porn-watching was more prevalent in the past. I favor a simpler interpretation: that because porn has not become mainstream, nor more taboo, people tell the truth at the same rates from the sexually liberated 1970s up to today. There are of course liars, but they don't seem concentrated in one period or another. How bad is the lying in any period, though? -- maybe all men are watching porn now but only 35% admit it. In 2003, the Nielsen Ratings people tracked the traffic of internet porn sites, and they found that 1 in 4 internet users visits porn sites (see here). That's just what we'd expect from the GSS results, which show that of men and women combined, 24% in 2002 and 26% in 2004 watched porn. Traffic doesn't lie, and because the numbers are virtually identical to what people say, we conclude that almost nobody lies about watching porn (at least in anonymous surveys). So not only have their proportions not increased relative to before, but porn-watchers are not even a majority of men -- a bit more than one-third. For women, even less so -- about one-sixth. Porn is not now, and never was, mainstream. Turning to porn in print, I collected circulation data for Playboy for any year I could find. The data are from many sources -- business sections of newspapers, histories of the magazine, etc. -- and for some years I couldn't find estimates. Still, there are plenty to see a clear pattern. I did the same for Maxim's US edition, both shown here: 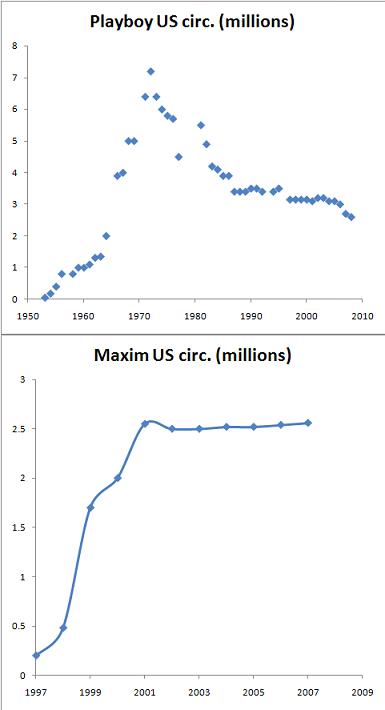 Playboy accelerated in popularity from its beginning in 1953 to 1973, after which it plummets until 1987, and then it slowly but steadily declines to today. I don't have rich data to show it, but from what I read in my research, the same rough pattern holds for other porn magazines like Penthouse and Hustler. Maxim looks like it's grown logistically, on analogy with a fad growing by word-of-mouth contagion. Maxim of course is not porn; the nearest thing might be 1940s pin-ups. I speculate that Playboy's exponential growth was due to featuring young brunette girl-next-door types, and its crash due to using blonder and older "power bitch" types. Maxim has done well, in this view, for relying so heavily on dark-haired women. In any event, we see that porn has not become mainstream in print either -- just the opposite. One last batch of data mostly from the UK, home of the "lad mag." Almost as soon as the fad had begun, it peaked and began plummeting, which has been well covered in the British press. I've shown it here for three of the most popular UK lad mags (I culled the data from various newspaper or other reports):  The US edition of FHM appeared to be doing well, even if it had begun to saturate. The drop-off I drew to show that it was abruptly canceled and only exists as a website now. Stuff Magazine, also once popular in the US, was cancelled in 2007. So even the non-porn but racy lad mags are dying off, save Maxim US. Because the "porn has become mainstream" meme is part of a panic -- either about eroding cultural standards, eroding barriers between public and private vis-a-vis sex, eroding relations between men and women due to unrealistic expectations, or the erosion of something else -- most of those who already believe it will not be persuaded by the stark clarity of the data here. (Hopefully the open-minded ones will end up reading this.) Like witch-hunters, they will shift the goalposts perhaps by saying, "Well yeah, but that just means that porn's influence is more subtle and covert, but no less pervasive and corrupting because of that." The first target will be female appearance, of course: as porn becomes more ubiquitous, they start dressing like sluts! Except that porn-watching increased most dramatically and reached a peak during the '80s -- the decade of high-waisted pants, granny-panties, and bulky manlike tops (baggy sweaters, shoulder-pads, etc.). I've written elsewhere about how girls don't even dress like sluts anymore, a 5-year fad in thongs notwithstanding. The second target will be sexual behavior: as porn becomes more ubiquitous, people will begin acting more promiscuously. But I've already shown that there was probably a single increase and single decrease in promiscuity, with the turning point around 1991. The popularity of porn either waxes and wanes for women or dips, increases and stays for men -- it has nothing to do with how promiscuous people are. Anyway, I could go on, but you get the idea. Let's all be done with this "porn has become mainstream" nonsense. Labels: babes and hunks, culture, GSS, porn
Tuesday, July 15, 2008
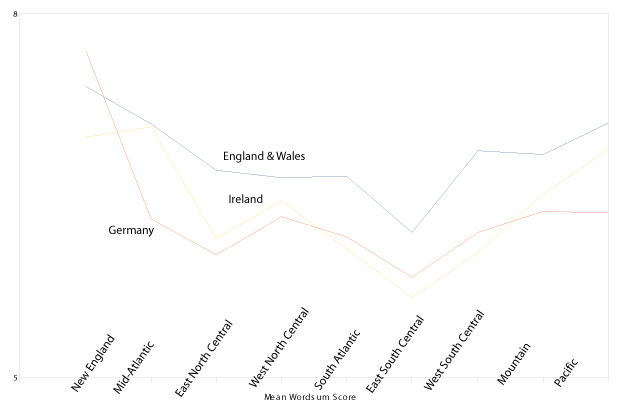
 In the post below, Colder climates favor civilization even among Whites alone, I made a few comments about possible differences between Germans in Illinois and Germans in Texas, based on nothing much more than a hunch. I trust my hunches, but there's no reason you should, so I decided to see if there was anything here in regards to my assumption about interregional differences in intelligence and how they might track across ethnic groups. So of course I went to the GSS website, and checked the mean WORDSUM scores of various white ethnic groups broken down by region. I specifically focused on whites who stated that their ancestors were from England & Wales, Germany and Ireland. My reasoning is that these are three groups with very large N's within the GSS sample and they are well represented across the regions in absolute numbers. My main motivation was see if the differences across regions were similar for all three groups. Here are the states for each region (the Census made up these categories): In the post below, Colder climates favor civilization even among Whites alone, I made a few comments about possible differences between Germans in Illinois and Germans in Texas, based on nothing much more than a hunch. I trust my hunches, but there's no reason you should, so I decided to see if there was anything here in regards to my assumption about interregional differences in intelligence and how they might track across ethnic groups. So of course I went to the GSS website, and checked the mean WORDSUM scores of various white ethnic groups broken down by region. I specifically focused on whites who stated that their ancestors were from England & Wales, Germany and Ireland. My reasoning is that these are three groups with very large N's within the GSS sample and they are well represented across the regions in absolute numbers. My main motivation was see if the differences across regions were similar for all three groups. Here are the states for each region (the Census made up these categories):New England - Maine, New Hampshire, Vermont, Massachusetts, Rhode Island, Connecticut Middle Atlantic - New York, New Jersey, Pennsylvania East North Central - Ohio, Indiana, Illinois, Michigan, Wisconsin West North Central - Minnesota, Iowa, Missouri, North Dakota, South Dakota, Nebraska, Kansas South Atlantic - Delaware, Maryland, District of Columbia, Virginia, West Virginia, North Carolina, South Carolina, Georgia, Florida East South Central - Kentucky, Tennessee, Alabama, Mississippi West South Central - Arkansas, Louisiana, Oklahoma, Texas Mountain - Montana, Idaho, Wyoming, Colorado, New Mexico, Arizona, Utah, Nevada Pacific - Washington, Imbler, California, Alaska, Hawaii Obviously the breakdown isn't ideal. I think Delaware and Maryland arguably should be Mid-Atlantic. I also believe that Wisconsin is more plausibly in the West North Central than Missouri or Kansas is. But those are the regional breakdowns and I can't do anything about them. So, WORDSUM is a vocabulary test on a 0-10 scale. For the whole GSS sample the mean was 6.00, with 1 standard deviation being 2.16. Below is a chart which shows the relationship between WORDSUM scores (Y axis) for various regions (X axis) for each of the three ethnic groups: 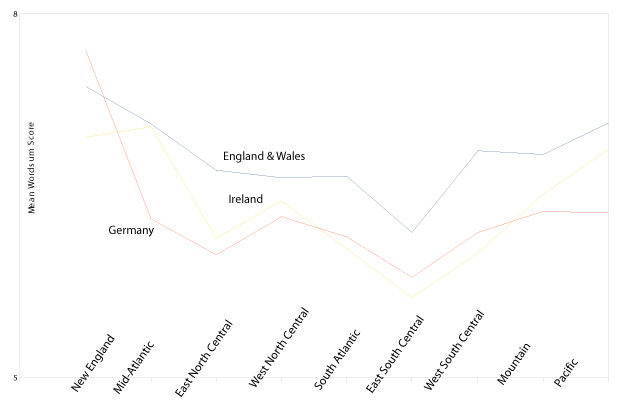 The tables below are pretty self-explanatory. At the top you see the mean WORDSUM scores for each ethnic group for each region. I put the N's in there as well so you can see that the sample sizes were pretty big. Note that there is more interregional variation within an ethnic group than there is interethnic variation within a region (the standard deviation across the columns is 50% bigger than across the rows). Just to be clear, I also included some tables which show the differences in WORDSUM mean scores between the regions like so: (row - column) = value.
Labels: civilization, climate, crime, education, GSS, IQ, true redneck stereotypes
Saturday, June 21, 2008
43% of young men who never go to church have a record, according to the Inductivist:
The same kind of pattern holds here. For men, 43% of those who never go to church have been arrested, while only 13% of the most frequent attenders have. The corresponding percentages for females is 14% and 8%. The results are from the GSS. The main question I would have are the affects of the background environment; in many socially conservative environments the expectation of involvement in a church is very strong and unchurched status could be a signal for anti-social tendencies. I know whereof I speak, I grew up for a while in a 3/4 Republican 99% white region of the Mountain West and those who were unchurched were often those who were "up to no good" (a small minority were secular liberals, but only a very small minority). My own prediction would be that this would be a more common phenomenon in a very religious country like the United States.
Friday, September 29, 2006
A question from Jason Malloy prompted a quick search of the GSS for data on the cause of the Black-White IQ gap. In 1982, the GSS characterized the skin color of Black participants on a 5-point scale (1:very dark brown to 5:very light brown). The very dark/light categories consist of only 50 and 14 individuals, respectively, and so in the following analysis I merged them with the dark/light brown categories, to give three COLOR levels: dark, medium, and light. In the web application, use COLOR(r:1-2;3;4-5) instead of COLOR. The WORDSUM variable is a 10 question vocabulary test, which I'm treating as a proxy for IQ. It is correlated with educational attainment (~.4), and also correlates (~.4-.5) with tests of reasoning and basic knowledge that were given in some years. These other tests are not available for 1982. In the all-subject all-year GSS data set, WORDSUM varies by SEX, and in 1982 COLOR also varies by SEX. Thus, SEX is controlled for in each analysis. WORDSUM is lower in the youngest and oldest age groups, so an AGE(25-65) filter was used.
Table 1. Mean WORDSUM score by COLOR and SEX with ANOVA
color indicates T-statistic, and thus p-value
We can quantify the effect size of each skin color class using Cohen's d statistic, which measures the mean difference in standard deviation units. In the 1982 dataset, the overall d for the Black-White gap on WORDSUM is -0.63 (among males d=-0.51, among d=-0.74). For comparison, the 1982 male-female gap among Whites is d=-.12, favoring females. Table 2. Effect size (d) of COLOR on WORDSUM using "light" as a control group
We can also use Whites as the control group. Table 3. Effect size (d) of COLOR on WORDSUM using Whites as a control group
Thus, there are substantial (moderate to large effect size) differences in WORDSUM scores between the darkest and lightest Blacks in 1982. As reported by Rushton and Jensen (2005), Shuey (1966) reviewed 18 studies which used skin color as a measure of racial admixture to compare with IQ. Of those 18, 16 found a significant effect of the kind found here, but the overall correlation with IQ was low (r=.1). In this data, the COLOR WORDSUM correlation is r=.31 among males and r=.18 among females, with an overall correlation of r=.23. Off the top of my head, I'm not certain what the expected correlation would be between IQ and skin color among Blacks for a given measure of "between-group heritability" (BGH) as described by Jensen (1998). I'll leave it as an exercise for our mathematically skilled commentators to derive a formula for this relationship and to evaluate the signficance of this finding in explaining the cause of the Black-White IQ gap. Labels: Economics, GSS, IQ, Pigmentation, race |
  Razib's Home Page GNXP Archives Interviews Blogroll Principles of Population Genetics Genetics of Populations Molecular Evolution Quantitative Genetics Evolutionary Quantitative Genetics Evolutionary Genetics Evolution Molecular Markers, Natural History, and Evolution The Genetics of Human Populations Genetics and Analysis of Quantitative Traits Epistasis and Evolutionary Process Evolutionary Human Genetics Biometry Mathematical Models in Biology Speciation Evolutionary Genetics: Case Studies and Concepts Narrow Roads of Gene Land 1 Narrow Roads of Gene Land 2 Narrow Roads of Gene Land 3 Statistical Methods in Molecular Evolution The History and Geography of Human Genes Population Genetics and Microevolutionary Theory Population Genetics, Molecular Evolution, and the Neutral Theory Genetical Theory of Natural Selection Evolution and the Genetics of Populations Genetics and Origins of Species Tempo and Mode in Evolution Causes of Evolution Evolution The Great Human Diasporas Bones, Stones and Molecules Natural Selection and Social Theory Journey of Man Mapping Human History The Seven Daughters of Eve Evolution for Everyone Why Sex Matters Mother Nature Grooming, Gossip, and the Evolution of Language Genome R.A. Fisher, the Life of a Scientist Sewall Wright and Evolutionary Biology Origins of Theoretical Population Genetics A Reason for Everything The Ancestor's Tale Dragon Bone Hill Endless Forms Most Beautiful The Selfish Gene Adaptation and Natural Selection Nature via Nurture The Symbolic Species The Imitation Factor The Red Queen Out of Thin Air Mutants Evolutionary Dynamics The Origin of Species The Descent of Man Age of Abundance The Darwin Wars The Evolutionists The Creationists Of Moths and Men The Language Instinct How We Decide Predictably Irrational The Black Swan Fooled By Randomness Descartes' Baby Religion Explained In Gods We Trust Darwin's Cathedral A Theory of Religion The Meme Machine Synaptic Self The Mating Mind A Separate Creation The Number Sense The 10,000 Year Explosion The Math Gene Explaining Culture Origin and Evolution of Cultures Dawn of Human Culture The Origins of Virtue Prehistory of the Mind The Nurture Assumption The Moral Animal Born That Way No Two Alike Sociobiology Survival of the Prettiest The Blank Slate The g Factor The Origin Of The Mind Unto Others Defenders of the Truth The Cultural Origins of Human Cognition Before the Dawn Behavioral Genetics in the Postgenomic Era The Essential Difference Geography of Thought The Classical World The Fall of the Roman Empire The Fall of Rome History of Rome How Rome Fell The Making of a Christian Aristoracy The Rise of Western Christendom Keepers of the Keys of Heaven A History of the Byzantine State and Society Europe After Rome The Germanization of Early Medieval Christianity The Barbarian Conversion A History of Christianity God's War Infidels Fourth Crusade and the Sack of Constantinople The Sacred Chain Divided by the Faith Europe The Reformation Pursuit of Glory Albion's Seed 1848 Postwar From Plato to Nato China: A New History China in World History Genghis Khan and the Making of the Modern World Children of the Revolution When Baghdad Ruled the Muslim World The Great Arab Conquests After Tamerlane A History of Iran The Horse, the Wheel, and Language A World History Guns, Germs, and Steel The Human Web Plagues and Peoples 1491 A Concise Economic History of the World Power and Plenty A Splendid Exchange Contours of the World Economy 1-2030 AD Knowledge and the Wealth of Nations A Farewell to Alms The Ascent of Money The Great Divergence Clash of Extremes War and Peace and War Historical Dynamics The Age of Lincoln The Great Upheaval What Hath God Wrought Freedom Just Around the Corner Throes of Democracy Grand New Party A Beautiful Math When Genius Failed Catholicism and Freedom American Judaism
Archives
July 2005 August 2005 September 2005 October 2005 November 2005 December 2005 January 2006 February 2006 March 2006 April 2006 May 2006 June 2006 July 2006 August 2006 September 2006 October 2006 November 2006 December 2006 January 2007 February 2007 March 2007 April 2007 May 2007 June 2007 July 2007 August 2007 September 2007 October 2007 November 2007 December 2007 January 2008 February 2008 March 2008 April 2008 May 2008 June 2008 July 2008 August 2008 September 2008 October 2008 November 2008 December 2008 January 2009 February 2009 March 2009 April 2009 May 2009 June 2009 July 2009 August 2009 September 2009 October 2009 November 2009 December 2009 January 2010 February 2010 Hello Movable Type archives August 11,2002 August 18,2002 August 25,2002 September 01,2002 September 15,2002 October 20,2002 December 08,2002 December 22,2002 December 29,2002 January 05,2003 January 12,2003 January 19,2003 January 26,2003 February 02,2003 February 09,2003 February 16,2003 February 23,2003 March 02,2003 March 09,2003 March 16,2003 March 23,2003 March 30,2003 April 06,2003 April 13,2003 April 20,2003 April 27,2003 May 04,2003 May 11,2003 May 18,2003 May 25,2003 June 01,2003 June 08,2003 June 15,2003 June 22,2003 June 29,2003 July 06,2003 July 13,2003 July 20,2003 July 27,2003 August 03,2003 August 10,2003 August 17,2003 August 24,2003 August 31,2003 September 07,2003 September 14,2003 September 21,2003 September 28,2003 October 05,2003 October 12,2003 October 19,2003 October 26,2003 November 02,2003 November 09,2003 November 16,2003 November 23,2003 November 30,2003 December 07,2003 December 14,2003 December 21,2003 December 28,2003 January 04,2004 January 11,2004 January 18,2004 January 25,2004 February 01,2004 February 08,2004 February 15,2004 February 22,2004 February 29,2004 March 07,2004 March 14,2004 March 21,2004 March 28,2004 April 04,2004 April 11,2004 April 18,2004 April 25,2004 May 02,2004 May 09,2004 May 16,2004 May 23,2004 May 30,2004 June 06,2004 June 13,2004 June 20,2004 June 27,2004 July 04,2004 July 11,2004 July 18,2004 July 25,2004 August 01,2004 August 08,2004 August 15,2004 August 22,2004 August 29,2004 September 05,2004 September 12,2004 September 19,2004 September 26,2004 October 03,2004 October 10,2004 October 17,2004 October 24,2004 October 31,2004 November 07,2004 November 14,2004 November 21,2004 November 28,2004 December 05,2004 December 12,2004 December 19,2004 December 26,2004 January 02,2005 January 09,2005 January 16,2005 January 23,2005 January 30,2005 February 06,2005 February 13,2005 February 20,2005 February 27,2005 March 06,2005 March 13,2005 March 20,2005 March 27,2005 April 03,2005 April 10,2005 April 17,2005 April 24,2005 May 01,2005 May 08,2005 May 15,2005 May 22,2005 May 29,2005 June 05,2005 June 12,2005 June 19,2005 June 26,2005 July 03,2005 July 17,2005 August 07,2005 Blogspot archives June 2002 July 2002 August 2002 September 2002 October 2002 November 2002 December 2002
10 questions for....
Parag Khanna James Flynn Jon Entine Gregory Clark György Buzsáki Heather Mac Donald Bruce Lahn A.W.F. Edwards Luigi Luca Cavalli-Sforza Joseph LeDoux Matthew Stewart Charles Murray James F. Crow Adam K. Webb Justin L. Barrett David Haig Judith Rich Harris Ken Miller Dan Sperber Warren Treadgold Armand M. Leroi John Derbyshire
Blogs
The GiveWell Blog Your Religion Is False Colby Cosh Steve Hsu Audacious Epigone Catallaxy Files Inductivist 2 Blowhards Genetic Future Agnostic Steve Sailer Dienekes Derek Lowe Razib Khan Razib at Comment is Free Secular Right Glenn Reynolds Jim Miller Kevin McGrew John Hawks Peter Fost Randall Parker Less Wrong Charles Murray Carl Zimmer EconLog Marginal Revolution
Principles of Population Genetics
Genetics of Populations Molecular Evolution Quantitative Genetics Evolutionary Quantitative Genetics Evolutionary Genetics Evolution Molecular Markers, Natural History, and Evolution The Genetics of Human Populations Genetics and Analysis of Quantitative Traits Epistasis and Evolutionary Process Evolutionary Human Genetics Biometry Mathematical Models in Biology Speciation Evolutionary Genetics: Case Studies and Concepts Narrow Roads of Gene Land 1 Narrow Roads of Gene Land 2 Narrow Roads of Gene Land 3 Statistical Methods in Molecular Evolution The History and Geography of Human Genes Population Genetics and Microevolutionary Theory Population Genetics, Molecular Evolution, and the Neutral Theory Genetical Theory of Natural Selection Evolution and the Genetics of Populations Genetics and Origins of Species Tempo and Mode in Evolution Causes of Evolution Evolution The Great Human Diasporas Bones, Stones and Molecules Natural Selection and Social Theory Journey of Man Mapping Human History The Seven Daughters of Eve Evolution for Everyone Why Sex Matters Mother Nature Grooming, Gossip, and the Evolution of Language Genome R.A. Fisher, the Life of a Scientist Sewall Wright and Evolutionary Biology Origins of Theoretical Population Genetics A Reason for Everything The Ancestor's Tale Dragon Bone Hill Endless Forms Most Beautiful The Selfish Gene Adaptation and Natural Selection Nature via Nurture The Symbolic Species The Imitation Factor The Red Queen Out of Thin Air Mutants Evolutionary Dynamics The Origin of Species The Descent of Man Age of Abundance The Darwin Wars The Evolutionists The Creationists Of Moths and Men The Language Instinct How We Decide Predictably Irrational The Black Swan Fooled By Randomness Descartes' Baby Religion Explained In Gods We Trust Darwin's Cathedral A Theory of Religion The Meme Machine Synaptic Self The Mating Mind A Separate Creation The Number Sense The 10,000 Year Explosion The Math Gene Explaining Culture Origin and Evolution of Cultures Dawn of Human Culture The Origins of Virtue Prehistory of the Mind The Nurture Assumption The Moral Animal Born That Way No Two Alike Sociobiology Survival of the Prettiest The Blank Slate The g Factor The Origin Of The Mind Unto Others Defenders of the Truth The Cultural Origins of Human Cognition Before the Dawn Behavioral Genetics in the Postgenomic Era The Essential Difference Geography of Thought The Classical World The Fall of the Roman Empire The Fall of Rome History of Rome How Rome Fell The Making of a Christian Aristoracy The Rise of Western Christendom Keepers of the Keys of Heaven A History of the Byzantine State and Society Europe After Rome The Germanization of Early Medieval Christianity The Barbarian Conversion A History of Christianity God's War Infidels Fourth Crusade and the Sack of Constantinople The Sacred Chain Divided by the Faith Europe The Reformation Pursuit of Glory Albion's Seed 1848 Postwar From Plato to Nato China: A New History China in World History Genghis Khan and the Making of the Modern World Children of the Revolution When Baghdad Ruled the Muslim World The Great Arab Conquests After Tamerlane A History of Iran The Horse, the Wheel, and Language A World History Guns, Germs, and Steel The Human Web Plagues and Peoples 1491 A Concise Economic History of the World Power and Plenty A Splendid Exchange Contours of the World Economy 1-2030 AD Knowledge and the Wealth of Nations A Farewell to Alms The Ascent of Money The Great Divergence Clash of Extremes War and Peace and War Historical Dynamics The Age of Lincoln The Great Upheaval What Hath God Wrought Freedom Just Around the Corner Throes of Democracy Grand New Party A Beautiful Math When Genius Failed Catholicism and Freedom American Judaism   Policies Terms of use © http://www.gnxp.com Razib's total feed: |
||||||||||||||||||||||||||||||||||||||||||||||||||||||||||||||||||||||||||||||||||||||||||||||||||||||||||||||||||||||||||||||||||||||||||||||||||||||||||||||||||||||||||||||||||||||||||||||||||||||||||||||||||||||||||||||||||||||||||||||||||||||||||||||||||||||||||||||||||||||||||||||||||||||||||||||||||||||||||||||||||||||||||||||||||||||||||||||||||||||||||||||||||||||||||||||||||||||||||||||||||||||||||||||||||||||||||||||||||||||||||||||||||||||||||||||||||||||||||||||||||||||||||||||||||||||||||||||||||||||||||||||||||||||||||||||||||||||||||||||||||||||||||||||||||||||||||||||||||||||||||||||||||||||||||||||||||||||||||||||||||||||||||||||||||||||||||||||||||||||||||||||||||||||||||