|
Wednesday, August 19, 2009
The greater fool theory 1: A mostly verbal mathematical model
posted by
agnostic @ 8/19/2009 09:22:00 PM
Here is a brief description of the idea that price bubbles are caused by people buying something, not necessarily because they think it's worth anything, but because they think they can find an even greater fool to buy it at a higher price. This continues until no more such fools can be found, and this bust drives prices back down to what they were before the boom began.
I didn't see any references to mathematical models of the theory at Wikipedia or through Googling around a bit, so I made one up today at Starbucks since I didn't have anything to read to pass the time. Because I'm not an economist, I don't know how original it is, or how it compares with alternative models of the greater fool theory (if they exist). So, this is intended just as an exercise in modeling, explaining the model, and hopefully shedding some light on how the world works. I've kept most of the exposition straightforward and largely verbal, so that you don't need to know much math at all to understand what the model says and what its implications are. In part 1, I lay out the logic of the model and explain enough of it to show that it is capable of producing a single round of boom-and-bust for price hype. Part 2 will provide more mathematical detail about how the dynamics unfold, a phase plane analysis, and graphs of how the variables of interest would change over time, to better wrap your brain around what the model predicts. This is a dynamic model, or one that tracks how things change over time -- after all, we want to see how price, the number of fools, etc., evolves. It is made of several differential equations, and all these equations say is what causes something of interest to go up or go down over time. (You may recall that the sign of a derivative tells you whether a function is increasing or decreasing, and the magnitude says by how much.) I'll only explain what is absolutely necessary for the reader to see what's going on, with the less necessary math being confined to footnotes. First, we set up the basic picture before we write down equations. My version of the greater fool theory goes like this. There is a population of people, and during a price bubble they can fall into three mutually exclusive groups: suckers (S), who are susceptible to joining in on the bubble; investors (I), who currently own the speculative stuff (such as a home bought for speculation); and those who are retired from the bubble (R), who used to be investors but have gotten rid of their investment. And of course there is the price of the thing -- I model only the extra price that it enjoys due to hype (P), above its fundamental value, since this is the only component of price that changes radically during the bubble. I set the population to be fixed in size during the bubble, since growth or decline is negligible over the handful of years that the bubble lasts. I also set the amount of speculative stuff to be fixed, which is less general -- supply should shoot up to meet the rising demand during a bubble. So, this model is restricted to cases where you can't produce lots more of the stuff, relative to how much already exists, on the time-scale of the bubble's boom stage (say, 5 years or less). Or perhaps no more of it will be produced at all, such as video game consoles from decades ago that the original manufacturers will never bring back into production, but which nostalgic fans have taken to buying and selling speculatively (like NEC's TurboDuo). Last, the amount of stuff that each investor has is the same across all investors and stays constant -- say, if each investor always owned just one speculative home. At the start of the bubble, there is a certain number of early investors. In order to sell their stuff, they need to meet a sucker to sell it to. When they meet -- and I assume the two groups are moving around independently of each other -- there is a probability that the sale will be made. If they make a deal, the sucker is now an investor, and the former investor is now retired. In this model, retireds do not again become suckers -- they consider themselves lucky to have found a greater fool and stay out of the bubble for good afterward. That's the extent of how people change between groups. As for price hype, again I'm not an economist, so the exact formula may differ from what's standard. I take it to respond positively to demand -- namely, the number of suckers -- and that there is a multiplier that serves as a reality check. This reality check should be weak at the start when most non-investors are suckers, and should be strong near the end when most non-investors are retired. In other words, the price hype at the beginning is a near total distortion -- nearly 0% accurate -- whereas the price hype near the end is nearly 100% accurate. This will make more sense once we write down formulas. Now we get to the differential equations for how these things change. We write down one equation for each variable whose values we're tracking over time. I use apostrophes to denote the derivative with respect to time (i.e., rate of change): S' = -aSI Since suckers can only lose members (by turning into investors), there is only one term, and it shows how suckers decline (negative sign). Remember, retireds do not go back into the pool of potential buyers. And investors either make a sale and go into the retired group, or they sit on their stuff in hope of selling, so they never contribute to the growth of suckers. Thus, there is no growth term. The parameter a shows the probability that, when a sucker and an investor meet, the investor will transfer his stuff to the sucker. ("Parameter" is another word for "constant," in contrast to a variable that changes.) The reason we use the product of S and I is that this is essentially the rate at which the two groups encounter each other when they move around independently of each other. [1] I' = aSI - aSI = 0 Investors both grow and decline, so one term is positive and the other negative. They grow by having a sucker join their ranks, which as we saw above happens at rate aSI. However, each time that happens, the investor loses his stuff and becomes retired. That happens at the same rate, and the negative sign just shows that this causes I to decline. When we simplify, we get I' = 0 -- that is, the number of investors does not change over time. That makes sense because each bundle of stuff always has an owner, regardless of how it may change hands, somewhat like the game of hot potato. When something doesn't change, it is constant, so whenever we see I from now on, we'll know that this is just another parameter, not a variable that changes. In particular, it refers to the initial number of early investors who get the bubble going. R' = aSI Retireds never join the suckers again. And recall the mindset of a retired person -- they knew the stuff was junk and are glad to have gotten through the selling process, so they cannot be sold the stuff again to become investors once more. Thus, there is no way for them to lose numbers. They grow by former investors making a sale and becoming retired, which once again happens at rate aSI. Here's the neat thing: notice that S' + R' = -aSI + aSI = 0. The sum of the two derivatives equals zero, and since taking a derivative shows the distributive property, this also means that (S + R)' = 0. That is, the sum of suckers and retireds does not change over time. This makes sense since, if the number of investors stays constant, the leftovers -- suckers and retireds -- is constant, regardless of how each separate group grows or shrinks. We can take this further to note that S' + I' + R' = 0, which means (S + I + R)' = 0. That is, the combined size of all three groups does not change over time -- which is just what we claimed by keeping total population size constant. (Otherwise, each group would have birth and death terms, aside from the terms that show how their members switch between groups.) We'll call this constant total population size N. So, S + I + R = N. Now, I is just a constant, so we'll move it to the other side: S + R = N - I. We have two variables, S and R, but we just wrote an equation connecting them, so we can re-write one in terms of the other. I'll choose R, but it doesn't matter. So, R = N - I - S, and anywhere we see R, we can replace it with N - I - S. In other words, we've removed R from our focus -- we can always get it from knowing what the variable S is, as well as the two parameters N and I. That means the equation for R' only gives us redundant information, and we can ignore it. We can also ignore the I' equation, since it just tells us that I is constant, and we're only interested in things that change. So we're left with just the S' equation. Now we move on to the price hype formula and how it changes over time. First, the formula for price as a function of demand and the reality check, since hype is never totally irrational and at least tries to take stock of reality: P = bS(R / Rmax) = bS(R / (N - I)) Demand is driven by the number of suckers -- the ones who eventually want to get in on the bubble -- and the parameter b says how strongly demand responds to the number of suckers. The multiplier (R / Rmax) provides a reality check. If you landed from Mars and only knew the number of suckers, you would also want to know how many retireds there were -- if there were few retireds, that would tell you the bubble had only just begun, so that hype is likely to be high and to go even higher short-term. Thus, this filter should not let much of the demand information through. Indeed, when R is very low compared to Rmax, the multiplier is near 0. However, if you saw that there were many retireds, that would say the bubble was near its bust moment, and that the information from demand is very accurate by this point. Indeed, when R is near Rmax, the multiplier is near 1 and the filter lets just about all of the demand information through. What is Rmax? It is the value when no one is a sucker and everyone is retired, aside from the constant number of investors. Looking above at the equation S + R = N - I, we see that when there are no suckers, R = N - I. Now we need to find the differential equation for how P changes over time. Using the product rule for derivatives [2], we get: P' = (abI / (N - I)) * S(2S + I - N) Since a, b, I, and N - I are always positive, and since S is positive except for the very end of the bubble when it is 0, in the meantime, whether price hype shoots up or crashes down depends on whether the term 2S + I - N is positive or negative. It is positive and price hype grows when S exceeds (N - I) / 2, which is half the size of non-investors. It is negative and price hype declines when S is below (N - I) / 2. It is 0 and price hype momentarily stalls out when S is exactly (N - I) / 2. Because the bubble starts with all non-investors being suckers, S is initially N - I, which is greater than (N - I) / 2. So at first the price hype shoots up. However, remember that S only declines -- as more and more of the suckers are drawn into the bubble (some of whom may also make sales and become retireds), S will inevitably fall below (N - I) / 2 and price hype will start to contract. When S inevitably reaches 0 -- when all non-investors are out of the bubble for good -- then P = 0 (recall that P = bS(R / Rmax)). Moreover, at that time P' = 0 too. Thus, at the end, price hype has completely evaporated and it will stay that way. This is a single round of boom-and-bust for price hype. In this post, I've shown how some pretty simple "greater fool" dynamics can lead to a boom-and-bust pattern for price hype. You can quibble with all of the assumptions I've made, but the model shows that the greater fools theory is a viable explanation for price bubbles. I've relaxed some of the assumptions to see if it makes a difference, like making the decline of S be a saturating rather than linear function of S, and so far they don't seem to affect things qualitatively. A more realistic model would have P appear in the equation for S' -- that is, to have price hype affect the probability of making a sale. Or rather, the trend of prices (P' ) should affect sale probability -- if suckers see that price hype is increasing, they should want to get in on the bubble, and to stay put if price hype is dropping. Also, allowing retireds to re-enter the pool of suckers would be more general and would almost certainly lead to sustained cycles of boom-and-bust, rather than a single round. But that's for another slow afternoon. In part 2, I'll go into more mathematical detail about how we see what states this system is at rest in, and whether they are stable to disruptions or not. I'll look more at the formula for the maximum level of price hype, and interpret that in real-world terms in order to see what things will give us larger-amplitude bubbles. I'll provide a picture of the phase plane, which shows what the equilibrium points are, and how the variables will change in value on their way from their starting values to the final ones. I'll also have a couple of graphs showing how the number of suckers and retireds, and the amount of price hype, change over time. [1] Draw one person at random, and the chance that they're a sucker reflects S. Draw another one at random, and the chance that they're an investor reflects I, since the draws are independent. The chance of doing both is just the product of the two separate probabilities. [2] P' = (bS(R / Rmax))' = (b / (Rmax)) (S' * R + S * R') A little algebra, which you can confirm by hand or using Maple, gives the equation in the main body for P'. Labels: Behavioral Economics, Economics, mathematics, Modeling
Thursday, March 05, 2009
Will information criteria replace p-values in common use? Some trends
posted by
agnostic @ 3/05/2009 12:30:00 AM
P-values come from null hypothesis testing, where you test how likely your observed data (and more extreme data) are under the assumption that the null hypothesis is true. As such, they do not allow us to decide which of a variety of hypotheses or models is true. The probability they encode refers to the observed data under an assumption -- it does not refer to the hypotheses on the table.
Using information criteria allows us to decide between a variety of hypotheses or models about how the world works. They formalize Occam's Razor by rewarding models that show a good fit to the observed data, while penalizing models that have lots of parameters to estimate (i.e., those that are more complex). Whichever one best balances this trade-off wins. Although I'm not a stats guy -- I'm much more at home cooking up models -- I've been told that the broader academic world is becoming increasingly hip to the idea of using information criteria, rather than insist on null hypothesis testing and reporting of p-values. So, let's see what JSTOR has to say. I did an advanced search of all articles for "p value" and for "Akaike Information Criterion" (the most popular one), looking at 5-year intervals just to save me some time and to smooth out the year-to-year variation. I start when the AIC is first mentioned. For the prevalence of each, I end in 2003, since there's typically a 5-year lag before articles end up in JSTOR, and estimating the prevalence requires a good guess about the population size. For the ratio of the size of one group to the other, I go up through 2008, since this ratio does not depend an accurate estimate of the total number of articles. From 2004 to 2008, there are 4132 articles with "p value" and 927 with "Akaike Infomration Criterion," so the estimate of the ratio isn't going to be bad even with fewer articles available during this time. Intervals are represented by their mid-point. Someone else can do the better job of searching year by year, perhaps restricting the search to social science journals to see if real headway is being made. (It would be uninteresting to see a rise of the popularity of information criteria in statistics journals.) Here are the trends in the use of each, as well as the ratio of p-value to AIC: 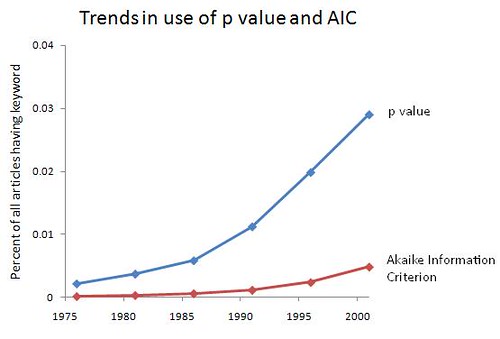 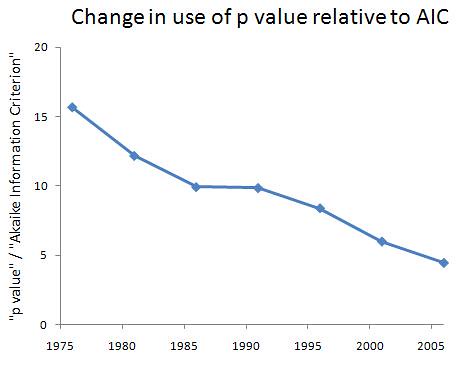 It's promising that both are increasing over the past 30-odd years, since that means more people are bothering to be quantitative. Still, less than 5% of articles mention p-values or information criteria -- some of that is due to the presence of arts and humanities journals, but there's still a big slice of the hard and soft sciences that needs to be converted. Also encouraging is the steady decline in the dominance of p-values to the AIC: they're still about 4.5 times as commonly used in academia at large, but that's down from about 15.5 times as common in the mid-1970s, a 71% decline. Graduate students and young professors -- the writing is on the wall. Aside from being intellectually superior, information criteria will give you a competitive edge in the job market, at least in the near future. After that, they will be required. Labels: academia, Modeling, Statistics
Monday, March 03, 2008
My old cyber-friend, "Georg Kantor", has a new English-language blog (his native language is Spanish): Social Equilibrium, which might be of interest to GNXP readers. In particular, check out his demographics tool, introduced on this post, "designed to produce transparent and easy population projections for non-professional users". Labels: Demographics, Modeling |
  Razib's Home Page GNXP Archives Interviews Blogroll Principles of Population Genetics Genetics of Populations Molecular Evolution Quantitative Genetics Evolutionary Quantitative Genetics Evolutionary Genetics Evolution Molecular Markers, Natural History, and Evolution The Genetics of Human Populations Genetics and Analysis of Quantitative Traits Epistasis and Evolutionary Process Evolutionary Human Genetics Biometry Mathematical Models in Biology Speciation Evolutionary Genetics: Case Studies and Concepts Narrow Roads of Gene Land 1 Narrow Roads of Gene Land 2 Narrow Roads of Gene Land 3 Statistical Methods in Molecular Evolution The History and Geography of Human Genes Population Genetics and Microevolutionary Theory Population Genetics, Molecular Evolution, and the Neutral Theory Genetical Theory of Natural Selection Evolution and the Genetics of Populations Genetics and Origins of Species Tempo and Mode in Evolution Causes of Evolution Evolution The Great Human Diasporas Bones, Stones and Molecules Natural Selection and Social Theory Journey of Man Mapping Human History The Seven Daughters of Eve Evolution for Everyone Why Sex Matters Mother Nature Grooming, Gossip, and the Evolution of Language Genome R.A. Fisher, the Life of a Scientist Sewall Wright and Evolutionary Biology Origins of Theoretical Population Genetics A Reason for Everything The Ancestor's Tale Dragon Bone Hill Endless Forms Most Beautiful The Selfish Gene Adaptation and Natural Selection Nature via Nurture The Symbolic Species The Imitation Factor The Red Queen Out of Thin Air Mutants Evolutionary Dynamics The Origin of Species The Descent of Man Age of Abundance The Darwin Wars The Evolutionists The Creationists Of Moths and Men The Language Instinct How We Decide Predictably Irrational The Black Swan Fooled By Randomness Descartes' Baby Religion Explained In Gods We Trust Darwin's Cathedral A Theory of Religion The Meme Machine Synaptic Self The Mating Mind A Separate Creation The Number Sense The 10,000 Year Explosion The Math Gene Explaining Culture Origin and Evolution of Cultures Dawn of Human Culture The Origins of Virtue Prehistory of the Mind The Nurture Assumption The Moral Animal Born That Way No Two Alike Sociobiology Survival of the Prettiest The Blank Slate The g Factor The Origin Of The Mind Unto Others Defenders of the Truth The Cultural Origins of Human Cognition Before the Dawn Behavioral Genetics in the Postgenomic Era The Essential Difference Geography of Thought The Classical World The Fall of the Roman Empire The Fall of Rome History of Rome How Rome Fell The Making of a Christian Aristoracy The Rise of Western Christendom Keepers of the Keys of Heaven A History of the Byzantine State and Society Europe After Rome The Germanization of Early Medieval Christianity The Barbarian Conversion A History of Christianity God's War Infidels Fourth Crusade and the Sack of Constantinople The Sacred Chain Divided by the Faith Europe The Reformation Pursuit of Glory Albion's Seed 1848 Postwar From Plato to Nato China: A New History China in World History Genghis Khan and the Making of the Modern World Children of the Revolution When Baghdad Ruled the Muslim World The Great Arab Conquests After Tamerlane A History of Iran The Horse, the Wheel, and Language A World History Guns, Germs, and Steel The Human Web Plagues and Peoples 1491 A Concise Economic History of the World Power and Plenty A Splendid Exchange Contours of the World Economy 1-2030 AD Knowledge and the Wealth of Nations A Farewell to Alms The Ascent of Money The Great Divergence Clash of Extremes War and Peace and War Historical Dynamics The Age of Lincoln The Great Upheaval What Hath God Wrought Freedom Just Around the Corner Throes of Democracy Grand New Party A Beautiful Math When Genius Failed Catholicism and Freedom American Judaism
Archives
July 2005 August 2005 September 2005 October 2005 November 2005 December 2005 January 2006 February 2006 March 2006 April 2006 May 2006 June 2006 July 2006 August 2006 September 2006 October 2006 November 2006 December 2006 January 2007 February 2007 March 2007 April 2007 May 2007 June 2007 July 2007 August 2007 September 2007 October 2007 November 2007 December 2007 January 2008 February 2008 March 2008 April 2008 May 2008 June 2008 July 2008 August 2008 September 2008 October 2008 November 2008 December 2008 January 2009 February 2009 March 2009 April 2009 May 2009 June 2009 July 2009 August 2009 September 2009 October 2009 November 2009 December 2009 January 2010 February 2010 Hello Movable Type archives August 11,2002 August 18,2002 August 25,2002 September 01,2002 September 15,2002 October 20,2002 December 08,2002 December 22,2002 December 29,2002 January 05,2003 January 12,2003 January 19,2003 January 26,2003 February 02,2003 February 09,2003 February 16,2003 February 23,2003 March 02,2003 March 09,2003 March 16,2003 March 23,2003 March 30,2003 April 06,2003 April 13,2003 April 20,2003 April 27,2003 May 04,2003 May 11,2003 May 18,2003 May 25,2003 June 01,2003 June 08,2003 June 15,2003 June 22,2003 June 29,2003 July 06,2003 July 13,2003 July 20,2003 July 27,2003 August 03,2003 August 10,2003 August 17,2003 August 24,2003 August 31,2003 September 07,2003 September 14,2003 September 21,2003 September 28,2003 October 05,2003 October 12,2003 October 19,2003 October 26,2003 November 02,2003 November 09,2003 November 16,2003 November 23,2003 November 30,2003 December 07,2003 December 14,2003 December 21,2003 December 28,2003 January 04,2004 January 11,2004 January 18,2004 January 25,2004 February 01,2004 February 08,2004 February 15,2004 February 22,2004 February 29,2004 March 07,2004 March 14,2004 March 21,2004 March 28,2004 April 04,2004 April 11,2004 April 18,2004 April 25,2004 May 02,2004 May 09,2004 May 16,2004 May 23,2004 May 30,2004 June 06,2004 June 13,2004 June 20,2004 June 27,2004 July 04,2004 July 11,2004 July 18,2004 July 25,2004 August 01,2004 August 08,2004 August 15,2004 August 22,2004 August 29,2004 September 05,2004 September 12,2004 September 19,2004 September 26,2004 October 03,2004 October 10,2004 October 17,2004 October 24,2004 October 31,2004 November 07,2004 November 14,2004 November 21,2004 November 28,2004 December 05,2004 December 12,2004 December 19,2004 December 26,2004 January 02,2005 January 09,2005 January 16,2005 January 23,2005 January 30,2005 February 06,2005 February 13,2005 February 20,2005 February 27,2005 March 06,2005 March 13,2005 March 20,2005 March 27,2005 April 03,2005 April 10,2005 April 17,2005 April 24,2005 May 01,2005 May 08,2005 May 15,2005 May 22,2005 May 29,2005 June 05,2005 June 12,2005 June 19,2005 June 26,2005 July 03,2005 July 17,2005 August 07,2005 Blogspot archives June 2002 July 2002 August 2002 September 2002 October 2002 November 2002 December 2002
10 questions for....
Parag Khanna James Flynn Jon Entine Gregory Clark György Buzsáki Heather Mac Donald Bruce Lahn A.W.F. Edwards Luigi Luca Cavalli-Sforza Joseph LeDoux Matthew Stewart Charles Murray James F. Crow Adam K. Webb Justin L. Barrett David Haig Judith Rich Harris Ken Miller Dan Sperber Warren Treadgold Armand M. Leroi John Derbyshire
Blogs
The GiveWell Blog Your Religion Is False Colby Cosh Steve Hsu Audacious Epigone Catallaxy Files Inductivist 2 Blowhards Genetic Future Agnostic Steve Sailer Dienekes Derek Lowe Razib Khan Razib at Comment is Free Secular Right Glenn Reynolds Jim Miller Kevin McGrew John Hawks Peter Fost Randall Parker Less Wrong Charles Murray Carl Zimmer EconLog Marginal Revolution
Principles of Population Genetics
Genetics of Populations Molecular Evolution Quantitative Genetics Evolutionary Quantitative Genetics Evolutionary Genetics Evolution Molecular Markers, Natural History, and Evolution The Genetics of Human Populations Genetics and Analysis of Quantitative Traits Epistasis and Evolutionary Process Evolutionary Human Genetics Biometry Mathematical Models in Biology Speciation Evolutionary Genetics: Case Studies and Concepts Narrow Roads of Gene Land 1 Narrow Roads of Gene Land 2 Narrow Roads of Gene Land 3 Statistical Methods in Molecular Evolution The History and Geography of Human Genes Population Genetics and Microevolutionary Theory Population Genetics, Molecular Evolution, and the Neutral Theory Genetical Theory of Natural Selection Evolution and the Genetics of Populations Genetics and Origins of Species Tempo and Mode in Evolution Causes of Evolution Evolution The Great Human Diasporas Bones, Stones and Molecules Natural Selection and Social Theory Journey of Man Mapping Human History The Seven Daughters of Eve Evolution for Everyone Why Sex Matters Mother Nature Grooming, Gossip, and the Evolution of Language Genome R.A. Fisher, the Life of a Scientist Sewall Wright and Evolutionary Biology Origins of Theoretical Population Genetics A Reason for Everything The Ancestor's Tale Dragon Bone Hill Endless Forms Most Beautiful The Selfish Gene Adaptation and Natural Selection Nature via Nurture The Symbolic Species The Imitation Factor The Red Queen Out of Thin Air Mutants Evolutionary Dynamics The Origin of Species The Descent of Man Age of Abundance The Darwin Wars The Evolutionists The Creationists Of Moths and Men The Language Instinct How We Decide Predictably Irrational The Black Swan Fooled By Randomness Descartes' Baby Religion Explained In Gods We Trust Darwin's Cathedral A Theory of Religion The Meme Machine Synaptic Self The Mating Mind A Separate Creation The Number Sense The 10,000 Year Explosion The Math Gene Explaining Culture Origin and Evolution of Cultures Dawn of Human Culture The Origins of Virtue Prehistory of the Mind The Nurture Assumption The Moral Animal Born That Way No Two Alike Sociobiology Survival of the Prettiest The Blank Slate The g Factor The Origin Of The Mind Unto Others Defenders of the Truth The Cultural Origins of Human Cognition Before the Dawn Behavioral Genetics in the Postgenomic Era The Essential Difference Geography of Thought The Classical World The Fall of the Roman Empire The Fall of Rome History of Rome How Rome Fell The Making of a Christian Aristoracy The Rise of Western Christendom Keepers of the Keys of Heaven A History of the Byzantine State and Society Europe After Rome The Germanization of Early Medieval Christianity The Barbarian Conversion A History of Christianity God's War Infidels Fourth Crusade and the Sack of Constantinople The Sacred Chain Divided by the Faith Europe The Reformation Pursuit of Glory Albion's Seed 1848 Postwar From Plato to Nato China: A New History China in World History Genghis Khan and the Making of the Modern World Children of the Revolution When Baghdad Ruled the Muslim World The Great Arab Conquests After Tamerlane A History of Iran The Horse, the Wheel, and Language A World History Guns, Germs, and Steel The Human Web Plagues and Peoples 1491 A Concise Economic History of the World Power and Plenty A Splendid Exchange Contours of the World Economy 1-2030 AD Knowledge and the Wealth of Nations A Farewell to Alms The Ascent of Money The Great Divergence Clash of Extremes War and Peace and War Historical Dynamics The Age of Lincoln The Great Upheaval What Hath God Wrought Freedom Just Around the Corner Throes of Democracy Grand New Party A Beautiful Math When Genius Failed Catholicism and Freedom American Judaism   Policies Terms of use © http://www.gnxp.com Razib's total feed: |