
Having already motivated this series, I’ll provide the first example of how to put your time to more productive use than participating in the WikiProject G.I. Joe or the still more urgent WikiProject Transformers. If you get interesting results, post them on your blog and provide a link in the comments here. I’ll gather up all the results after awhile and summarize them in a follow-up post.
Purpose
Cultural transmission has often been described verbally as viral. Mathematical models of culture incorporate this idea by borrowing epidemic disease models from biology. The goal here is to see if data on “viral videos” support the infectious model of culture.
Pre-requisites
To collect and analyze data: high school algebra, including familiarity with exponentials and logarithms. To get the theory behind the model: first-semester calculus and preferably an understanding of phase plane methods to study a two-variable system of ordinary differenital equations. [1] No knowledge of biology or culture is needed.
Details
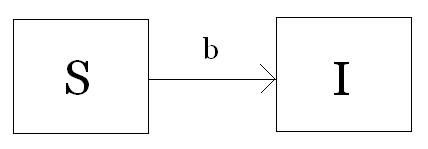
Edelstein-Keshet’s Mathematical Models in Biology (pp. 242 – 254) provides a good overview of the most basic models of epidemic diseases, and that’s what I’m adapting here. In brief, we track the growth rates of two or three classes of hosts: Susceptibles (S), Infectives (I), and perhaps Recovereds (R). The names mean what you think. In the case of viral videos, you can never undo having seen the video, so we will use a very simple model, illustrated below:
If you haven’t seen the video yet, you’re Susceptible, while if you have seen it, you’re Infective. The idea is that someone who’s seen the video tells their friends about it in some way, and their friends watch it in their turn. A Susceptible is turned into an Infective at a rate b, so that this parameter measures the infectivity of the video.
We ignore the part of the population that has immunity to the video — perhaps because they are not in the target demographic group — and only track those who could be or are infected. We also assume that on the time-scale that the video spreads, the population is constant in size, which seems realistic in this case.
We can write down a system of differential equations for the above picture:
dS / dt = – bSI
dI / dt = bSI
(The product SI is used as an analogy with chemistry’s law of mass action for particles that knock into or interact with each other.)
We notice that dS / dt + dI / dt = 0, which means that S + I = constant, call it N. In other words, if we know the number of Infectives, we automatically know the number of Susceptibles — it is just N – I. Therefore, we don’t have to keep a separate tally of the change in S and can eliminate the first equation. Subsituting S = N – I into the second equation, our system becomes just:
dI / dt = bI(N – I)
Let’s make a natural change of variables:
i = I / N
g = bN
So, i is the fraction of the population that is Infective, and the growth rate g has units of inverse time (where b had units of 1 / (people * time)). The equation now only has one variable and one parameter:
di / dt = gi(1 – i)
This is the famous logistic equation, which you may already have seen in the context of saturating population growth or the spread of a favored allele to fixation. (The analogies between these three processes are reflected in their being modeled by the same equation, which underscores the importance of formalizing your intuition.)
At equilibrium, the fraction that is Infective does not change, so di / dt = 0. This happens when either i = 0 or i = 1. When i is between 0 and 1, di / dt is positive, so as long as i is not exactly 0, i will increase as time increases and will ultimately end up at i = 1. In other words, i = 0 is an unstable steady-state since a small increase will push it to i = 1, which is stable.
This model may seem simplistic since it implies that every single Susceptible will be eventually see the video, but that’s not so unrealistic when you recall that we’re only considering the population of the video’s target audience — in 1993, how many teenagers who had TVs in their homes never, ever saw that Blind Melon video with the bee girl? Some videos may have larger or smaller target audiences, i.e. larger or smaller values of the parameter N.
Getting and Analyzing Data
It is impractical for someone without the funding to survey a large random sample of the target audience to attempt to do so. Therefore, we would measure a good enough proxy: the view count for a YouTube video, tracked over time. Depending on how rapidly you think it will increase, you may want to measure it every 6 hours, or once a day. If it grows logistically, it should accelerate first and then still increase but decelerate until it more or less plateaus, like this the picture in the Wikipedia page on the logistic function.
Ideally, you want to track a video that is the only one of its kind — if there are multiple copies of the same video, that complicates things somewhat, but you might ignore that (see Further Avenues). For example, if a YouTube celebrity is able to curb reproductions of their videos, you can simply wait until their channel puts out a new video. The infectious process would go something like, “Omigod, So-and-So just put out a new video — you have to see it!” This would be easier if they update fairly infrequently, so that word-of-mouth transmission were the primary route of infection.
Another idea is to wait for the music video of a popular song to come out, but this requires that you be pretty savvy about music trends, and here the potential of multiple copies is even more serious, as fans download it and upload it themselves.
Fad news items are another source, like when that retarded brat got tasered in the UCLA library. Again, multiple copies of it will probably appear.
Assuming you got something like logistic growth, here’s how you estimate the parameters N and b. Well, N would just be whatever the plateau value seems to be, so you’ll have to wait for it to do so first. It can be shown that the solution to the logistic equation can be re-arranged to yield:
ln ((N – I) / I) = – bt + ln ((N – I0) / I0)
Where N is the max view count, I0 is the initial view count — pick some small number — I is the view count at time t, and b is the infectivity rate. So after you’ve got a concrete number for N and I0, you’d plot (N – I) / I on a ln scale — it will be a linear function of t, with y-intercept = ln ((N – I0) / I0) and slope = – b. See what b turns out to be.
Then compare values of N and b for different videos. If N is larger for one, that means the target audience is larger (ignoring the fact that a single person may watch a given video multiple times — that’s true for any video, no matter the target audience’s size). If b is larger for one, that means it’s more infectious.
If you really kept this going long-term, you could try to classify the videos you’re tracking by category and do an analysis of variance or something to see what accounts for the variation in the target audience size and in the infectiousness of a video. Intuitively, we expect more sensational videos to have higher b — but a hard analysis might tell us more concretely what types of things count as more sensational. We have guesses about that, but we need data to see if those guesses are right.
To make the model a bit more complex, you could introduce a stochastic component to the growth equation. Right now, it is deterministic: as long as the ball gets rolling, everyone in the target audience will see the video. But when few people have seen the video, chance effects could push one ball up while letting another ball stay put. This is like when several copies of a favored allele are introduced into a population — some will be lost by drift, while another may be propelled quickly by drift at the start, after which point the deterministic equations take over. You would model it just like the frequency of a favored allele under the combined effects of drift and directional selection.
In the context of viral videos, consider multiple copies of the same music video (again due to fans downloading the video from the official channel and uploading it to their own channel). As the target audience does a search for this video, chance effects may propel one of the copies up very quickly while letting other copies languish with low view counts. In this case, the copy that ends up dominating the market increases even more rapidly than under the purely deterministic model because it got a lucky big initial boost through sheer chance effects.
This is what makes is somewhat inappropriate to compare a video that only has one copy to see vs. a video with multiple copies to see. The winner in the latter group will appear more infectious than the former, since it increases much faster, but part of that higher increase is accounted for by chance.
[1] MIT’s Open CourseWare site has a great mathematics section that allows you to teach yourself or brush up on these areas. Especially useful is the course on differential equations, which has a full set of video lectures, solved problem sets, exams, and helpful Java applets. An easy to use phase plane applet is pplane.
Comments are closed.