Substack cometh, and lo it is good. (Pricing)

Japan as a natural cultural experiment

History of Japan is a good survey for anyone curious about the topic because it is short enough to not be intimidating (this was a complaint from friends who I recommended read The Making of Modern Japan), but dense enough to actually be much more informative than a Wikipedia entry. Unlike many surveys of Japanese history, it does not operationally begin with Oda Nobunaga. The extensive treatment of the Nara and Heian period is something that I particularly appreciated since often these are explored only in specialist monographs with any depth.

One of the curious things about Japan is that since the conquest of the Emishi of northern Honshu around 800 AD, the Japanese lost an external frontier with another people. True, there were periods of endemic warfare between Japanese when central authority collapsed, but by and large, these conflicts were arguably less destructive than shocks from without would have been. Wars within cultural groups are highly destructive, but often they are governed by unified cultural scripts and mores.

In Strange Parallels: Mainland Mirrors: Europe, Japan, China, South Asia, and the Islands, the historian Victor Lieberman examines Japan as a case study of a “protected-zone” civilization. In Lieberman’s framework, the emergence of organized steppe nomadism in the years after the fall of Rome and China caused stress and chaos across what Nichols Spyman would term the “Eurasian rimland,” and what the ancients would have termed the civilized oikoumene. The same model crops up in Ian Morris’ War! What Is It Good For?: Conflict and the Progress of Civilization from Primates to Robots.

The development of the chariot during the Bronze Age was arguably an integrative force in the evolution of agricultural polities. Chariots were useful for the transport and deployment of elite warriors and archers. But, they were not utilized as shock troops, as would be the case with the rise of mounted cavalry. First emerging around 1000 BC on the western edge of the Eurasian steppe, by 0 AD the mounted cavalry had given birth to full-blown nomadism from Europe to China. To some extent, the only way that core civilizations on the Eurasian rimland could maintain themselves in the face of the pure nomadic assault was through co-option and assimilation. Arabs, Turks, and Mongols all swallowed up earlier settled civilizations. In the Near East, China, and India,  peoples of nomadic origin became the ruling classes, synthesizing and integrating with the traditions of those they conquered.

In contrast, much of Western Europe and Southeast Asia were protected from these incursions due to distance, topography, and climate. The German barbarians who took over the reins of power in the post-Roman world were agro-pastoralists, not nomads. In mainland Southeast Asia, the Tai incursions was a migration of agriculturalist warrior elites. The modern states of Cambodia, Vietnam, and Burma withstood the assaults and maintained cultural continuity with their past. In Western Europe, Ireland can be thought of as an analogous case, though the Viking shocks, and later Anglo-Normand conquest, disrupted its continuity.

Lieberman argues in Strange Parallels that these protected-zone societies are much more natural nation-states than elsewhere, in part because their organic identity from earlier cultural traditions persisted down to the modern era, as opposed to having been created anew through novel ideologies. And is it a surprise that of the European nations England, which has not undergone a mass invasion since 1066*, has one of the deepest self-conceptions as a nation-state?

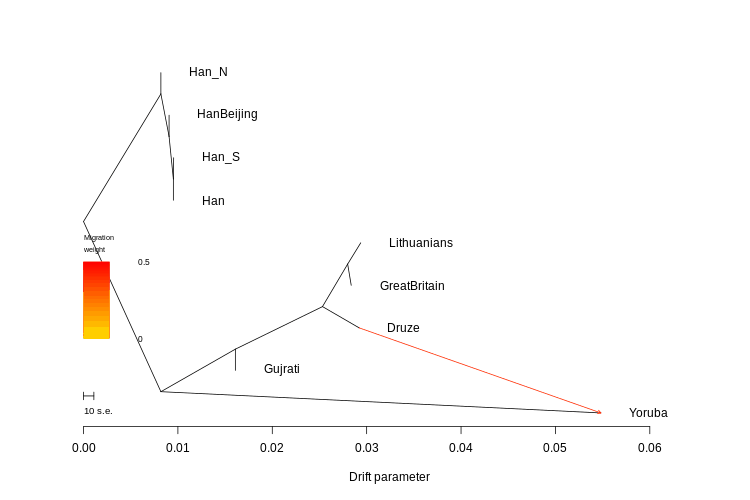
Which brings us back to Japan: its imperial family dates at least the early 6th century AD. Though we don’t have verified dates before the Emperor Kinmei, it seems likely that the Imperial House of Yamato is quite a bit older than that. Unlike in the West then the Japanese have a much easier line of descent from antiquity for its elites. The persistence of the Japanese imperial family is a testament to the cultural prominence that the Yamato lineage has, with all of its ups and downs. In contrast, the arrival of waves of barbarians in other regions of the Eurasian rimlands produces a situation where taboos against taking official power eventually broke down. In the 5th century West Roman Empire, there was a taboo against barbarians or people of part-barbarian ancestry from becoming Emperor. Eventually, the barbarians got rid of the Emperor, and over the centuries became Emperors themselves. The same process is evident in the Islamic world, where the Arab Caliphs remained figureheads for Persian and Turkic potentates until they took over both de jure and de facto roles.

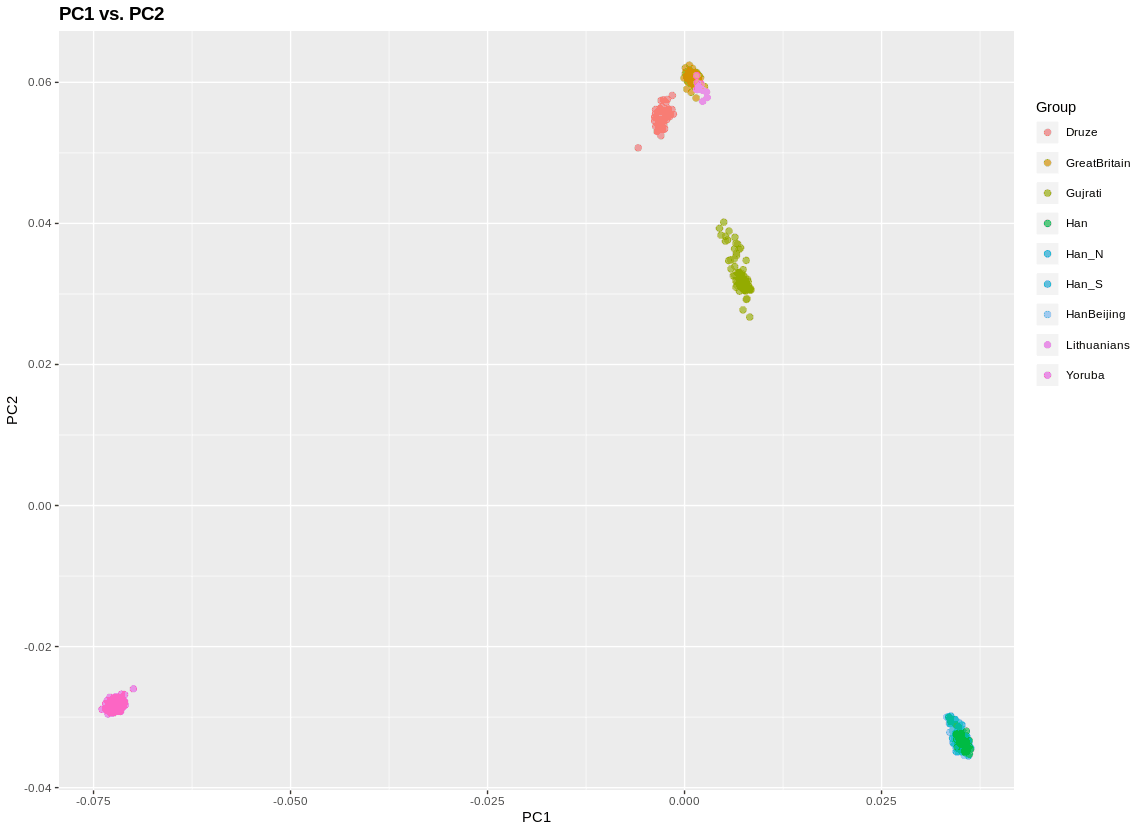
The Japanese have a different experience. At the beginning of their history, they were a cohesive culture expanding into the post-Jomon frontier. Though reinforced with an elite migration of Koreans and Chinese prior to the Fujiwara period, unlike polities across Eurasia the Japanese ruling class have been uniformly and continuously of the same ethnicity and identity as the populace which it ruled.** And, unlike the Vietnamese or Koreans, they have not been subjected to conquest and hegemony by China. They have long been of the Sinic sphere, not within the Sinic sphere.

Between Korea and Japan, there is a 200 km distance by water. In contrast, between England and France, there are about 30 km. This greater distance explains the relative isolation of Japan in comparison to England when it comes to continental affairs. Proto-historical expeditions in Korea, or Hideyoshi’s adventure, are exceptions, not the rule.  Official contacts between Japan and China often had gaps of centuries.

This is not to say that Japan was not influenced by the continent. Obviously, Buddhism, Chinese writing, and the wholesale transplantation of Tang culture during the Fujiwara period attest to the early influences, while later on even during the Tokugawa era there were influences from Western thought via the Dutch. Rather, the Japanese are a natural experiment of a people who have repeatedly engaged with the world on their own terms, and developed their own culture organically to such an extent that they put their ancient tribal animism, Shinto, as the state religion during their phase of modernization!

In answer to the question “why is Japan different?” I would say this is a peculiarity of geography, close enough to be influenced culturally, but distant enough to be politically isolated.

* I think the Dutch invasion under William of Orange really was an invasion. But its impact was mild due to broad local support.

** Contrast this with ethnically distinct ruling elites in the Near East, India, and China, as well as cosmopolitan ruling families in Europe. Even England was for several centuries ruled by a nobility which spoke French.


Substack cometh, and lo it is good. (Pricing)

How the fall of the Roman state and persistence of Roman culture led to the modern world


The above map is from a new preprint, The Origins of WEIRD Psychology. If you don’t know, WEIRD refers to “western, educated, industrialized, rich and democratic.” And, it focuses on the problem that so much of psychological research has been done through surveys and experiments on university students, who tend to be from the more privileged half of developed societies in the West.

Despite the title, this preprint is less about the particularity and distinctiveness of WEIRD psychology subjects, but rather the socio-historical and cultural context from which WEIRD has developed. From the abstract:

We propose that much of this variation arose as people psychologically adapted to differing kin-based institutions—the set of social norms governing descent, marriage, residence and related domains. We further propose that part of the variation in these institutions arose historically from the Catholic Church’s marriage and family policies, which contributed to the dissolution of Europe’s traditional kin-based institutions, leading eventually to the predominance of nuclear families and impersonal institutions. By combining data on 20 psychological outcomes with historical measures of both kinship and Church exposure, we find support for these ideas in a comprehensive array of analyses across countries, among European regions and between individuals with different cultural backgrounds.

The hypothesis itself is not entirely novel. I first encountered the argument that the Western Church was critical in eliminating the familial strategies used by Late Antique Roman elites to maintain their power and wealth in Adam Bellow’s book In Praise of Nepotism. This preprint outlines the exact process which Bellow described: the Western Church constrained and limited the pool of possible mates through incredibly stringent incest regulations, as well banning adoption and other ways to prevent lineage extinction. Bellow presents an almost materialist thesis, whereby the Western Church consolidated its power and wealth through regulating the personal lives of Western Europe’s ruling elite. By destroying powerful pedigrees not only did the Church eliminate a temporal rival, but often the wealth of these elite lineages went to the Church if there were no heirs.

I’ll get back to the history in a bit. But first it has to be admitted that formalizing and quantifying these patterns is the value of this preprint. It would be easy for me to critique a particular set of variables, but there are so many, and they did so many robustness checks, that it hard to deny that the authors picked up some signal in the data. Probably the most persuasive aspect is that some of the signals persist within countries. That is, areas subject more to Western Church coercion for longer periods exhibit reduced kinship intensity down to the present. In most of the world lineage groups and familialism were and are much more pervasive and powerful than in the medieval West, where non-familial organizations such as guilds and monasteries stepped into the gap. What we might call “civil society” or the “small platoons.” These became “high trust” societies, and set the stage for the cultural and economic revolution of early modernity, from science to industrialization and the flourishing of democratic liberalism.

There have been many debates about why Europe underwent lift-off after 1500. Some of the models rely on exceedingly simple causes, such as the discovery of the New World releasing parts of Atlantic Europe from Malthusian pressures, as well as the location of coal in accessible regions of England. It seems possible that a single necessary and sufficient cause does not exist. The combination of the European discovery of the New World, along with their relatively open and high-trust societies engendered by the dissolution of extended clan structures by the Western Church was likely a potent cocktail.

In any case, I want to revisit the issue of how and why the Western Church went the route that it did. Because Christians in other parts of the world did not reform family structure in the say way. As hinted in the preprint, it may have to with the fact that the collapse of the imperial order in the West resulted in the devolution to the Church certain powers that would otherwise have been accorded to the state. In the lands of post-Roman West local bishops had the power of princes. Even the Pope in Rome took the role of a prince on more than one occasion. But, they also had the power of religion, which for all practical purposes was magic. To make a nerdy allusion, the bishops of the post-Roman world were both Aragorn and Gandalf in one. They were priest-kings.

The same did not hold in the East Roman Empire. Though the Eastern Orthodox Churches have often clashed with rulers, they were much more subordinate for all practical purposes than the Western Church. The East Roman Empire maintained the bureaucratic function of the Roman world down to the medieval period. In contrast, much of the apparatus of state control withered in the post-Roman West, as it devolved into feudalism. The Western Church maintained the cultural connection with Romanitas in the West in a landscape where the authority of Rome had vanished. That cultural connection was channeled through Christianity, where marriage was a sacrament which the Church controlled. Though there were plenty of aristocrats in the post-Roman West, the political systems of control were relatively weak. The Western Church was a solid and critical institution which spanned the patchwork of independent dominions which characterized the political landscape. It was indispensable.

In a world where Rome did not fall, which to all practical purposes was the case in the East, the Church would have had a more normal role in society. It would not have been able to engage in a social engineering project, because established powers would have blunted its will. This is clearly the case in other societies. In addition, the Church also had accrued to itself a monopoly on provision of religious services in Late Antiquity, and so it had recourse to avenues of leverage not feasible for secular rulers.

The pervasive power of the Western Church even in the face of the rise of social and political complexity in the late medieval period is illustrated by the impact of the Reformation. In Protestant areas of Europe religion became much more strictly subordinated to the ruler. Pastors became more like civil servants than independent sources of power. Two dynamics emerged rapidly with the adoption of Protestantism. First, the cousin marriage became more common among elite lineages again (e.g., Charles Darwin married his cousin). Second, young women were forced into marriages against their will more often than in Catholic Europe, where becoming a nun was often an option. To some extent Protestantism exacerbated the tendency to treat and see women bargaining chips in negotiations between elite lineages.

As the authors note in the preprint inbred lineage groups to come to the fore and operate as the atomic units of social organization in a society among agriculturalists. This is in contrast to hunter-gatherers, who seem to want to create kinship ties to distant people. There are clear differences between foragers and farmers in this model. Dense sedentary living fosters the emergence of endogamous kinship groups as natural cultural adaptations. The peculiarity about Western Europe is that this society broke out of this “default state,” and even after the Protestant Reformation it never went back. It may be that European society is now at a different equilibrium, or, that the economic lift-off of the last 500 years has allowed for individualism to persist even where the role of the Church in breaking up tight kinship groups has been blocked.

This preprint is a big deal, because it brings quantitative methods to a field which has been long on speculation. But there’s a real phenomenon that needs to be explored.

Addendum: The blogger “hbd chick” has suggested that she should have been cited, as she has been talking about these issues relating to family structure and the Church for many years.  I am not taking any sides, but just pointing that out.

Substack cometh, and lo it is good. (Pricing)

The new African “multi-regionalism” & pan-Neanderthalism

We live in times when our understanding of the origin and diversification of modern humans is undergoing great change. More concretely, our understanding of what it means to be human is transforming. The terms are overused, but perhaps it could be called a “revolution” or “paradigm shift” between the year 2000 and today.

At the end of 2010 ancient DNA made it highly likely that people outside of Sub-Saharan Africa had non-trivial Neanderthal ancestry. That is, enough ancestry that it is detectable genomically. I should also add that I think it is highly probable that the good majority of people within Sub-Saharan Africa have Neanderthal ancestry. Some of this is due to recent attenuated Eurasian back-migration (e.g., many West Africans, Nilotic people, and KhoeSan have Holocene gene-flow signals which derive from the agricultural expansions of the past 10,000 years). But, I think once deep Pleistocene genomes of African humans are sequenced we will see evidence of some Eurasian back-migration at a very ancient date (there is already some suggestive inferential evidence of this).*

Talking with a few friends this week, I realized that the famous “We are all Africans” t-shirts, which have turned into recognizable memes, should be supplemented with “We are all Neanderthals” t-shirts. So yeah, now selling them on DNA Geeks. If the Richard Dawkins Foundation can make quid on it, why not the Razib Khan et al. Foundation?

This has all been on my mind due to a review paper in Trends in Ecology and Evolution, Did Our Species Evolve in Subdivided Populations across Africa, and Why Does It Matter? (OA). If you read this blog closely you’ll see there’s not much new in it. But, it is a signpost, a marker, of the times we live in. Here’s the important bit:

Together with recent archaeological and genetic lines of evidence, these data are consistent with the view that our species originated and diversified within strongly subdivided (i.e., structured) populations, probably living across Africa, that were connected by sporadic gene flow…This concept of ‘African multiregionalism’…may also include hybridization between H. sapiens and more divergent hominins (see Glossary) living in different regions…Crucially, such population subdivisions may have been shaped and sustained by shifts in ecological boundaries…challenging the view that our species was endemic to a single region or habitat, and implying an often underacknowledged complexity to our African origins.

The first person who explicitly used the term “African multi-regionalism” that I recall was Alwyn Scally, though the general framework was shaping up years before. Frankly, I was waiting for someone to use that word. If Richard Klein’s The Dawn of Human Culture, published in 2002, was the apogee of the old model, often inchoate and more crisp in popularization than within the scientific community that we are all descended from a single East African tribe, this review paper heralds the emergence of a more complex and pluralistic framework. The emergence of modern humans within Africa then may have been a polycentric gradual and interactive process; not a singular explosion against the firmament of the antique savanna landscape.

By the late 2000s, even before the 2010 Neanderthal draft genome paper, it was starting to be evident due to genome-wide analyses of contemporary populations, that the extreme bottleneck clear in non-African populations was much more modest within Africa. That opened the possibility for the existence of deep structure within the continent that pre-dated the “Out of Africa” event. A deeper look at African hunter-gatherers indicated to many researchers that these groups diverged from other modern humans in the range of ~200,000 years before the well. Recent paleontological work has confirmed this genetic insight.

Where we are today is that some people are now arguing for the overthrow of the “Out-of-Africa” idea, whether by replacing it with an “Into-Africa” model of some sort, or resurrecting a more polycentric classical multi-regionalism (“some people” as evident in the increased frequency of emails and Twitter messages I get in this vein). I don’t think we’re there yet, not by any measure. But, it is now in the realm of very unlikely, not extremely unlikely (at least the “Into-Africa” model; it is clear that strong overwhelming demographic pulses from somewhere singular dominate the genome of most modern humans).

* I don’t think it is all that implausible that some Neanderthal back-migration into Africa occurred at some point in the last ~500,000.

Substack cometh, and lo it is good. (Pricing)

Open Thread, 07/17/2018

History of Japan: Revised Edition. As I said, a pretty good and short history. Recommended.

CRISPR/Cas9 gene editing scissors are less accurate than we thought, but there are fixes. I know the focus is on human genetics. And rightly so. But this isn’t going to be as much of an issue in animal and plant breeding.

Patterns of speciation and parallel genetic evolution under adaptation from standing variation.

Genome-wide analysis in UK Biobank identifies over 100 QTLs associated with muscle mass variability in middle age individuals.

Amazon told me R for Everyone: Advanced Analytics and Graphics was on sale. Great. But I already own it. That being said, I can tell you it’s a pretty good book.

Genome doubling shapes the evolution and prognosis of advanced cancers.

Against Moral Equivalence. “The talking heads trafficking in examples of U.S. interference neglect to mention that the goal of American policy has always been to prop up anti-totalitarian, pro-market leaders.” I dislike the tendency of American conservatism to conflate anti-authoritarian and pro-market. The two are distinct (I’m pro-market for what it’s worth, but capitalism is amoral, even though it leads to greater human well-being).

Large randomized controlled trial finds state pre-k program has adverse effects on academic achievement.

Archaeobotanical evidence reveals the origins of bread 14,400 years ago in northeastern Jordan.

Confronting Implicit Bias in the New York Police Department. Implicit bias stuff is sketchy science. But people want solutions for social problems.

How Social Science Might Be Misunderstanding Conservatives. I got introduced to the “authoritarian personality” in college. I didn’t think much about it, but over the years it seemed pretty clearly a bit rigged. But whatever. Then I read The Dialectical Imagination: A History of the Frankfurt School and the Institute of Social Research, 1923-1950. That’s where it comes from. Enough said, right?

Tides of History is a great podcast. Now Patrick Wyman is talking about the “Hundred Years War.”

Should I post “open threads” anymore? It seems that the number of comments keeps dropping. Really “everything” is moving to Twitter nowadays though Twitter is a wasteland.

A “carvaka” perspective historicity of myth and religion. A long post on Brown Pundits by me. Was asked once why I post there and not here, and why here and not there. 45% of the readers of that weblog are from Indian IPs. 5% here. About twice as much traffic here, but much more engagement there (bounce rate 70% vs. 40%).

Substack cometh, and lo it is good. (Pricing)

India vs. China, genetically diverse vs. homogeneous

About 36% of the world’s population are citizens of the Peoples’ Republic of China and the Republic of India. Including the other nations of South Asia (Pakistan, Bangladesh, etc.), 43% of the population lives in China and/or South Asia.

But, as David Reich mentions in Who We Are and How We Got Here China is dominated by one ethnicity, the Han, while India is a constellation of ethnicities. And this is reflected in the genetics. The relatively diversity of India stands in contrast to the homogeneity of China.

At the current time, the best research on population genetic variation within China is probably the preprint A comprehensive map of genetic variation in the world’s largest ethnic group – Han Chinese. The author used low-coverage sequencing of over 10,000 women to get a huge sample size of variation all across China. The PCA analysis recapitulated earlier work. Genetic relatedness among the Han of China is geographically structured. The largest component of variance is north-south, but a smaller component is also east-west. The north-south element explains more than 4.5 times the variance as the east-west.

Read More

Substack cometh, and lo it is good. (Pricing)

Tutorial to run supervised admixture analyses

IDDaiGujratiLithuaniansSardinianTamil
razib_23andMe0.140.260.020.000.58
razib_ancestry0.140.260.020.000.58
razib_ftdna0.140.260.020.000.57
razib_daughter0.050.140.290.180.34
razib_son0.070.170.280.190.30
razib_son_20.060.190.290.190.27
razib_wife0.000.070.550.380.00

This is a follow-up to my earlier post, Tutorial To Run PCA, Admixture, Treemix And Pairwise Fst In One Command. Hopefully, you’ll be able to run supervised admixture analysis with less hassle after reading this. Here I’m pretty much aiming for laypeople. If you are a trainee you need to write your own scripts. The main goal here is to allow people to run a lot of tests to develop an intuition for this stuff.

The above results are from a supervised admixture analysis of my family and myself. The fact that there are three replicates of me is because I converted my 23andMe, Ancestry, and Family Tree DNA raw data into plink files three times. Notice that the results are broadly consistent. This emphasizes that discrepancies between DTC companies in their results are due to their analytic pipeline, not because of data quality.

The results are not surprising. I’m about ~14% “Dai”, reflecting East Asian admixture into Bengalis. My wife is ~0% “Dai”. My children are somewhere in between. At a low fraction, you expect some variance in the F1.

Now below are results for three Swedes with the same reference panel:

GroupIDDaiGujratiLithuaniansSardinianTamil
SwedenSweden170.000.090.630.280.00
SwedenSweden180.000.080.620.310.00
SwedenSweden200.000.050.720.230.00

All these were run on supervised admixture frameworks where I used Dai, Gujrati, Lithuanians, Sardinians, and Tamils, as the reference “ancestral” populations. Another way to think about it is: taking the genetic variation of these input groups, what fractions does a given test focal individual shake out at?

The commands are rather simple. For my family:
bash rawFile_To_Supervised_Results.sh TestScript

For the Swedes:
bash supervisedTest.sh Sweden TestScript

The commands need to be run in a folder: ancestry_supervised/.

You can download the zip file. Decompress and put it somewhere you can find it.

Here is what the scripts do. First, imagine you have raw genotype files downloaded from 23andMe, Ancestry, and Family Tree DNA.

Download the files as usual. Rename them in an intelligible way, because the file names are going to be used for generating IDs. So above, I renamed them “razib_23andMe.txt” and such because I wanted to recognize the downstream files produced from each raw genotype. Leave the extensions as they are. You need to make sure they are not compressed obviously. Then place them all in  RAWINPUT/.

The script looks for the files in there. You don’t need to specify names, it will find them. In plink the family ID and individual ID will be taken from the text before the extension in the file name. Output files will also have the file name.

Aside from the raw genotype files, you need to determine a reference file. In REFERENCEFILES/ you see the binary pedigree/plink file Est1000HGDP. The same file from the earlier post. It would be crazy to run supervised admixture on the dozens of populations in this file. You need to create a subset.

For the above I did this:
grep "Dai\|Guj\|Lithua\|Sardi\|Tamil" Est1000HGDP.fam > ../keep.keep

Then:
./plink --bfile REFERENCEFILES/Est1000HGDP --keep keep.keep --make-bed --out REFERENCEFILES/TestScript

When the script runs, it converts the raw genotype files into plink files, and puts them in INDIVPLINKFILES/. Then it takes each plink file and uses it as a test against the reference population file. That file has a preprend on group/family IDs of the form AA_Ref_. This is essential for the script to understand that this is a reference population. The .pop files are automatically generated, and the script inputs in the correct K by looking for unique population numbers.

The admixture is going to be slow. I recommend you modify runadmixture.pl by adding the number of cores parameters so it can go multi-threaded.

When the script is done it will put the results in RESULTFILES/. They will be .csv files with strange names (they will have the original file name you provided, but there are timestamps in there so that if you run the files with a different reference and such it won’t overwrite everything). Each individual is run separately and has a separate output file (a .csv).

But this is not always convenient. Sometimes you want to test a larger batch of individuals. Perhaps you want to use the reference file I provided as a source for a population to test? For the Swedes I did this:
grep "Swede" REFERENCEFILES/Est1000HGDP.fam > ../keep.keep

Then:
./plink --bfile REFERENCEFILES/Est1000HGDP --keep keep.keep --make-bed --out INDIVPLINKFILES/Sweden

Please note the folder. There are modifications you can make, but the script assumes that the test files are inINDIVPLINKFILES/. The next part is important. The Swedish individuals will have AA_Ref_ prepended on each row since you got them out of Est1000HGDP. You need to remove this. If you don’t remove it, it won’t work. In my case, I modified using the vim editor:
vim Sweden.fam

You can do it with a text editor too. It doesn’t matter. Though it has to be the .fam file.

After the script is done, it will put the .csv file in RESULTFILES/. It will be a single .csv with multiple rows. Each individual is tested separately though, so what the script does is append each result to the file (the individuals are output to different plink files and merged in; you don’ t need to know the details). If you have 100 individuals, it will take a long time. You may want to look in the .csv file as the individuals are being added to make sure it looks right.

The convenience of these scripts is that it does some merging/flipping/cleaning for you. And, it formats the output so you don’t have to.

I originally developed these scripts on a Mac, but to get it to work on Ubuntu I made a few small modifications. I don’t know if it still works on Mac, but you should be able to make the modifications if not. Remember for a Mac you will need the make versions of plink and admixture.

For supervised analysis, the reference populations need to make sense and be coherent. Please check the earlier tutorial and use the PCA functions to remove outliers.

Again, here is the download to the zip files. And, remember, this only works on Ubuntu for sure (though now I hear it’s easy to run Ubuntu in Windows).

Substack cometh, and lo it is good. (Pricing)

Tutorial to run PCA, Admixture, Treemix and pairwise Fst in one command


Today on Twitter I stated that “if the average person knew how to run PCA with plink and visualize with R they wouldn’t need to ask me anything.” What I meant by this is that the average person often asks me “Razib, is population X closer to population Y than Z?” To answer this sort of question I dig through my datasets and run a few exploratory analyses, and get back to them.

I’ve been meaning to write up and distribute a “quickstart” for a while to help people do their own analyses. So here I go.

The audience of this post is probably two-fold:

  1. “Trainees” who are starting graduate school and want to dig in quickly into empirical data sets while they’re really getting a handle on things. This tutorial will probably suffice for a week. You should quickly move on to three population and four population tests, and Eigensoft and AdmixTools. As well fineStructure
  2. The larger audience is technically oriented readers who are not, and never will be, geneticists professionally. 

What do you need? First, you need to be able to work in a Linux or Linux-environment. I work both in Ubuntu and on a Mac, but this tutorial and these scripts were tested on Ubuntu. They should work OK on a Mac, but there may need to be some modifications on the bash scripts and such.

Assuming you have a Linux environment, you need to download this zip or tar.xz file. Once you open this file it should decompress a folderancestry/.

There are a bunch of files in there. Some of them are scripts I wrote. Some of them are output files that aren’t cleaned up. Some of them are packages that you’ve heard of. Of the latter:

  • admixture
  • plink
  • treemix

You can find these online too, though these versions should work out of the box on Ubuntu. If you have a Mac, you need the Mac versions. Just replace the Mac versions into the folderancestry/. You may need some libraries installed into Ubuntu too if you recompile yourselves. Check the errors and make search engines your friends.

You will need to install R (or R Studio). If you are running Mac or Ubuntu on the command line you know how to get R. If not, Google it.

I also put some data in the file. In particular, a plink set of files Est1000HGDP. These are merged from the Estonian Biocentre, HGDP, and 1000 Genomes. There are 4,899 individuals in the data, with 135,000 high-quality SNPs (very low missingness).

If you look in the “family” file you will see an important part of the structure. So do:

less Est1000HGDP.fam

You’ll see something like this:
Abhkasians abh154 0 0 1 -9
Abhkasians abh165 0 0 1 -9
Abkhazian abkhazian1_1m 0 0 2 -9
Abkhazian abkhazian5_1m 0 0 1 -9
Abkhazian abkhazian6_1m 0 0 1 -9
AfricanBarbados HG01879 0 0 0 -9
AfricanBarbados HG01880 0 0 0 -9

There are 4,899 rows corresponding to each individual. I have used the first column to label the ethnic/group identity. The second column is the individual ID. You can ignore the last 4 columns.

There is no way you want to analyze all the different ethnic groups. Usually, you want to look at a few. For that, you can use lots of commands, but what you need is a subset of the rows above. The grep command matches and returns rows with particular patterns. It’s handy. Let’s say I want just Yoruba, British (who are in the group GreatBritain), Gujurati, Han Chinese, and Druze. The command below will work (note that Han matches HanBeijing, Han_S, Han_N, etc.).

grep "Yoruba\|Great\|Guj\|Han\|Druze" Est1000HGDP.fam > keep.txt

The file keep.txt has the individuals you want. Now you put it through plink to generate a new file:

./plink --bfile Est1000HGDP --keep keep.txt --make-bed --out EstSubset

This new file has only 634 individuals. That’s more manageable. But more important is that there are far fewer groups for visualization and analysis.

As for that analysis, I have a Perl script with a bash script within it (and some system commands). Here is what they do:

1) they perform PCA to 10 dimensions
2) then they run admixture on the number of K clusters you want (unsupervised), and generate a .csv file you can look at
3) then I wrote a script to do pairwise Fst between populations, and output the data into a text file
4) finally, I create the input file necessary for the treemix package and then run treemix with the number of migrations you want

There are lots of parameters and specifications for these packages. You don’t get those unless you to edit the scripts or make them more extensible (I have versions that are more flexible but I think newbies will just get confused so I’m keeping it simple).

Assuming I create the plink file above, running the following commands mean that admixture does K = 2 and treemix does 1 migration edge (that is, -m 1). The PCA and pairwise Fst automatically runs.

perl pairwise.perl EstSubset 2 1

Just walk away from your box for a while. The admixture will take the longest. If you want to speed it up, figure out how many cores you have, and edit the file makecluster.sh, go to line 16 where you see admixture. If you have 4 cores, then type -j4 as a parameter. It will speed admixture up and hog all your cores.

There is as .csv that has the admixture output. EstSubset.admix.csv. If you open it you see something like this:
Druze HGDP00603 0.550210 0.449790
Druze HGDP00604 0.569070 0.430930
Druze HGDP00605 0.562854 0.437146
Druze HGDP00606 0.555205 0.444795
GreatBritain HG00096 0.598871 0.401129
GreatBritain HG00097 0.590040 0.409960
GreatBritain HG00099 0.592654 0.407346
GreatBritain HG00100 0.590847 0.409153

Column 1 will always be the group, column 2 the individual, and all subsequent columns will be the K’s. Since K = 2, there are two columns. Space separated. You should be able to open the .csv or process it however you want to process it.

You’ll also see two other files: plink.eigenval plink.eigenvec. These are generic output files for the PCA. The .eigenvec file has the individuals along with the values for each PC. The .eigenval file shows the magnitude of the dimension. It looks like this:
68.7974
38.4125
7.16859
3.3837
2.05858
1.85725
1.73196
1.63946
1.56449
1.53666

Basically, this means that PC 1 explains twice as much of the variance as PC 2. Beyond PC 4 it looks like they’re really bunched together. You can open up this file as a .csv and visualize it however you like. But I gave you an R script. It’s RPCA.R.

You need to install some packages. First, open R or R studio. If you want to go command line at the terminal, type R. Then type:
install.packages("ggplot2")
install.packages("reshape2")
install.packages("plyr")
install.packages("ape")
install.packages("igraph")
install.packages("ggplot2")

Once those packages are loaded you can use the script:
source("RPCA.R")

Then, to generate the plot at the top of this post:
plinkPCA()

There are some useful parameters in this function. The plot to the left adds some shape labels to highlight two populations. A third population I label by individual ID. This second is important if you want to do outlier pruning, since there are mislabels, or just plain outlier individuals, in a lot of data (including in this). I also zoomed in.

Here’s how I did that:
plinkPCA(subVec = c("Druze","GreatBritain"),labelPlot = c("Lithuanians"),xLim=c(-0.01,0.0125),yLim=c(0.05,0.062))

To look at stuff besides PC 1 and PC 2 you can do plinkPCA(PC=c("PC3","PC6")).

I put the PCA function in the script, but to remove individuals you will want to run the PCA manually:

./plink --bfile EstSubset --pca 10

You can remove individuals manually by creating a remove file. What I like to do though is something like this:
grep "randomID27 " EstSubset.fam >> remove.txt

The double-carat appends to the remove.txt file, so you can add individuals in the terminal in one window while running PCA and visualizing with R in the other (Eigensoft has an automatic outlier removal feature). Once you have the individuals you want to remove, then:

./plink --bfile EstSubset --remove remove.txt --make-bed --out EstSubset
./plink --bfile EstSubset --pca 10

Then visualize!

To make use of the pairwise Fst you need the fst.R script. If everything is set up right, all you need to do is type:
source("fst.R")

It will load the file and generate the tree. You can modify the script so you have an unrooted tree too.

The R script is what generates the FstMatrix.csv file, which has the matrix you know and love.

So now you have the PCA, Fst and admixture. What else? Well, there’s treemix.

I set the number of SNPs for the blocks to be 1000. So -k 1000. As well as global rearrangement. You can change the details in the perl script itself. Look to the bottom. I think the main utility of my script is that it generates the input files. The treemix package isn’t hard to run once you have those input files.

Also, as you know treemix comes with R plotting functions. So run treemix with however many migration edges (you can have 0), and then when the script is done, load R.

Then:
>source("src/plotting_funcs.R")
>plot_tree("TreeMix")

But actually, you don’t need to do the above. I added a script to generate a .png file with the treemix plot in pairwise.perl. It’s called TreeMix.TreeMix.Tree.png.

OK, so that’s it.

To review:

Download zip or tar.xz file. Decompress. All the packages and scripts should be in there, along with a pretty big dataset of modern populations. If you are on a non-Mac Linux you are good to go. If you are on a Mac, you need the Mac versions of admixture, plink, and treemix. I’m going to warn you compiling treemix can be kind of a pain. I’ve done it on Linux and Mac machines, and gotten it to work, but sometimes it took time.

You need R and/or R Studio (or something like R Studio). Make sure to install the packages or the scripts for visualizing results from PCA and pairwiseFst won’t work.*

There is already a .csv output from admixture. The PCA also generates expected output files. You may want to sort, so open it in a spreadsheet.

This is potentially just the start. But if you are a layperson with a nagging question and can’t wait for me, this could be you where you need to go!

* I wrote a lot of these things piecemeal and often a long time ago. It may be that not all the packages are even used. Don’t bother to tell me.

Substack cometh, and lo it is good. (Pricing)

Drawing on the slate of human nature

Some of you have been reading me since 2002. Therefore, you’ve seen a lot of changes in my interests (and to a lesser extent, my life…no more cat pictures because my cats died). Whereas today I incessantly flog Who We Are and How We Got Here: Ancient DNA and the New Science of the Human Past, in 2002 I would talk about Steven Pinker’s The Blank Slate: The Modern Denial of Human Nature quite a bit. The reason I don’t talk much about The Blank Slate is that some point in the 2000s I realized my future deep interests were going to be in population genetics, rather than behavior genetics and cognitive psychology. If you are not a specialist who doesn’t follow the literature. Who doesn’t “read the supplements”. You’re going to stop gaining anything more from books at a certain point.

Similarly, after I read In Gods We Trust: The Evolutionary Landscape of Religion, I read a lot of books on the cognitive anthropology of religion. Until I didn’t. Now that Harvey Whitehouse has teamed up with Peter Turchin, I suspect I’ll check in on this literature again.

But life comes at you fast. Today I think the broad thesis of The Blank Slate seems so correct, that we are not a “blank slate”, that no one would argue with that. Rather, the implications of that thesis are highly “problematic,” and social and cultural constructionism has really gone much further on the Left operationally than they were in the early 2000s. To give a concrete example, you can admit that sex differences are real and significant, but you have to be very careful in mentioning or highlighting specific instances or cases where they matter.

Moving to a more controversial topic, for a long while I’ve pretty much ignored the genomic study of the normal variation of cognition. The reason is that until recently all the studies were very underpowered to detect much of anything. The sample sizes were too small in relation to the genetic architecture of the trait because of the “Fourth Law of Behavior Genetics.”

As 2018 proceeds I think we can say that we are now in new territory. On Twitter, Steve Hsu seems positively ecstatic over a paper that just came out in PNAS. His blog post, Game Over: Genomic Prediction of Social Mobility summarizes it pretty well, but you should read the open access paper.

Genetic analysis of social-class mobility in five longitudinal studies:

Genome-wide association study (GWAS) discoveries about educational attainment have raised questions about the meaning of the genetics of success. These discoveries could offer clues about biological mechanisms or, because children inherit genetics and social class from parents, education-linked genetics could be spurious correlates of socially transmitted advantages. To distinguish between these hypotheses, we studied social mobility in five cohorts from three countries. We found that people with more education-linked genetics were more successful compared with parents and siblings. We also found mothers’ education-linked genetics predicted their children’s attainment over and above the children’s own genetics, indicating an environmentally mediated genetic effect. Findings reject pure social-transmission explanations of education GWAS discoveries. Instead, genetics influences attainment directly through social mobility and indirectly through family environments.

Why does this matter? I’m assuming most of you have seen charts like the ones below, which “prove” how the game is rigged against the poor:

The problem that most behavior geneticists immediately have with these popular analyses, which now suffuse our public culture (e.g., the “representation” argument in academic science often takes as a cartoonish model that all groups will have equal representation in all fields given no discrimination; substantively almost everyone believes this isn’t true in some way, but for the sake of argumentation this is a bullet-proof line of attack which every white male academic is going to retreat away from), is that they ignore genetic confounds. This paper is an attempt to address that. Measure it. Quantify it. Characterize it.

The two most interesting results for me have to do with siblings and mothers. Unsurprisingly siblings who have a higher predicted educational attainment score genetically tend to have higher educational attainments. As you know, siblings vary in relatedness. They vary in the segregation of alleles from their parents. Some siblings are tall. Some are short. This is due to variation in genetics across the pedigree. People within a family are related to each other, but unless you are talking Targaryens they aren’t exactly alike. Similarly, some siblings are smart and some are not so smart, because they’re “born that way.”

We knew that. Soon we’ll understand that genomically I suspect.

Second, we see again the importance of maternal effects and non-transmitted alleles. Mothers who have a higher predicted level of education have children with more education even if those children don’t inherit those alleles.* One natural conclusion here is mothers with a particular disposition shaped by genes are creating particular environments for their children, and those environments let them flourish even if they do not have their mother’s genetic endowments. This actually has “news you can use” implications in life choices people make in relation to their partners.

The study ends on a cautionary note. Residual population substructure can cause issues, correcting which can attenuate or eliminate such subtle and small signals. The sample sizes could always get bigger. And ethnically diverse panels have to come into the picture at some point.

But Razib abides. This study had a combined sample size of >20,000 individuals. Then you have the other recent paper with 270,000 individuals, Genome-wide association meta-analysis in 269,867 individuals identifies new genetic and functional links to intelligence. All well and good, but I wait for greater things. There is no shame in waiting for better things. And I prophesy that a greater sample size shall come to pass before this year turns into the new.

And you know what’s better than 1 million samples? How about 1 billion samples!

* Note that the models are controlling for a lot of background socioeconomic variables.

Substack cometh, and lo it is good. (Pricing)

The coming end of 150 years of the USA as the largest economy

Note: GDP is log-transformed!

Most projections usually predict that China will be the largest economy by the year 2030. This got me thinking: when exactly did the USA surpass other nations? I knew it was in the 19th century, but I wasn’t sure exactly when.

GDP estimates are always somewhat dicey, and they were even more so in the past. But the above plot* is representative of what you can find online: the USA became #1 in the decade or so after the Civil War. What surprised me is that the nation it surpassed was China! Around 1880 the USA overtook China, and around 2030 China will overtake the USA. That’s 150 years of American singular economic dominance. Curiously, for a period India was #3, just as it will be in 2030 (though its GDP will be far lower than #2 USA by most estimates).

I am aware that on a per capita basis America will be the most affluent large society in the world for decades beyond the point when its economy is not the largest. My only observation is that we are living to see the end of a particular phase in world history.

One aspect of this that I wonder about is that it is a fact that to some extent in the late 19th and early 20th century America refused to take over the role of the world’s preeminent power from the United Kingdom long after it had become the most consequential economic force. To be frank, it was clear in the early 20th century that the UK was simply longer up to the task, and arguably a great deal of suffering might have been alleviated if the United States had stepped into its natural role earlier. Now I wouldn’t be surprised if the inverse occurred in the second quarter of the 21st century: the USA, like Britain, continues to play the role of hyperpower hegemon longer after it’s able to carry out that role credibly. I hope I’m wrong.

* Data from Barry Ritholtz’s blog.

Substack cometh, and lo it is good. (Pricing)

The hegemon and world-citizen

On occasion, I read a book…and forget its title. I usually manage to recall the title at some point. For the past five years or so I’ve been trying to recall a book I read on Asian diplomatic history written by a Korean American scholar. Today I finally recalled that book: East Asia Before the West: Five Centuries of Trade and Tribute.

The reason I’ve been trying to remember this book is that I’ve felt it told a story which is more relevant today than in the late 2000s, when the book was written and published. From the summary:

Focusing on the role of the “tribute system” in maintaining stability in East Asia and in fostering diplomatic and commercial exchange, Kang contrasts this history against the example of Europe and the East Asian states’ skirmishes with nomadic peoples to the north and west. Although China has been the unquestioned hegemon in the region, with other political units always considered secondary, the tributary order entailed military, cultural, and economic dimensions that afforded its participants immense latitude. Europe’s “Westphalian” system, on the other hand, was based on formal equality among states and balance-of-power politics, resulting in incessant interstate conflict.

Here’s my not-so-counterintuitive prediction: as China flexes its geopolitical muscles, it will revert back to form in substance, forging a foreign policy predicated on hierarchical relationships between states, while maintaining an external adherence to the system of European diplomacy which crystallized between the Peace of Westphalia and the Congress of Vienna, that emphasized the importance of equality between states. “Diplomacy with Chinese characteristics” if you will.