I feel that for whatever reason that over the past few years that many people have started to exhibit weak intuitions about the magnitude of between population differences on this weblog. Two suggestions for why this might occur.
* First, the proliferation of PCA plots with individuals can make it hard to discern averages
* Second, model-based admixture plots don’t explicitly quantify the differences between the different clusters
To get a better sense of between-group differences I decided to take a step back and look at Fst. Fst basically looks all the genetic variance between groups and quantifies the proportion that can be attributed to differences between groups.

The plot at the top of this post is from an Fst matrix I generated with Plink (I wrote a script to do the pairwise comparison). I did some PCA pruning of the populations to be clear (e.g., with both Cambodians and Filipinos I made them more distinct than they would otherwise be). The goal was to give people a sense of genetic distances within regions and between them.
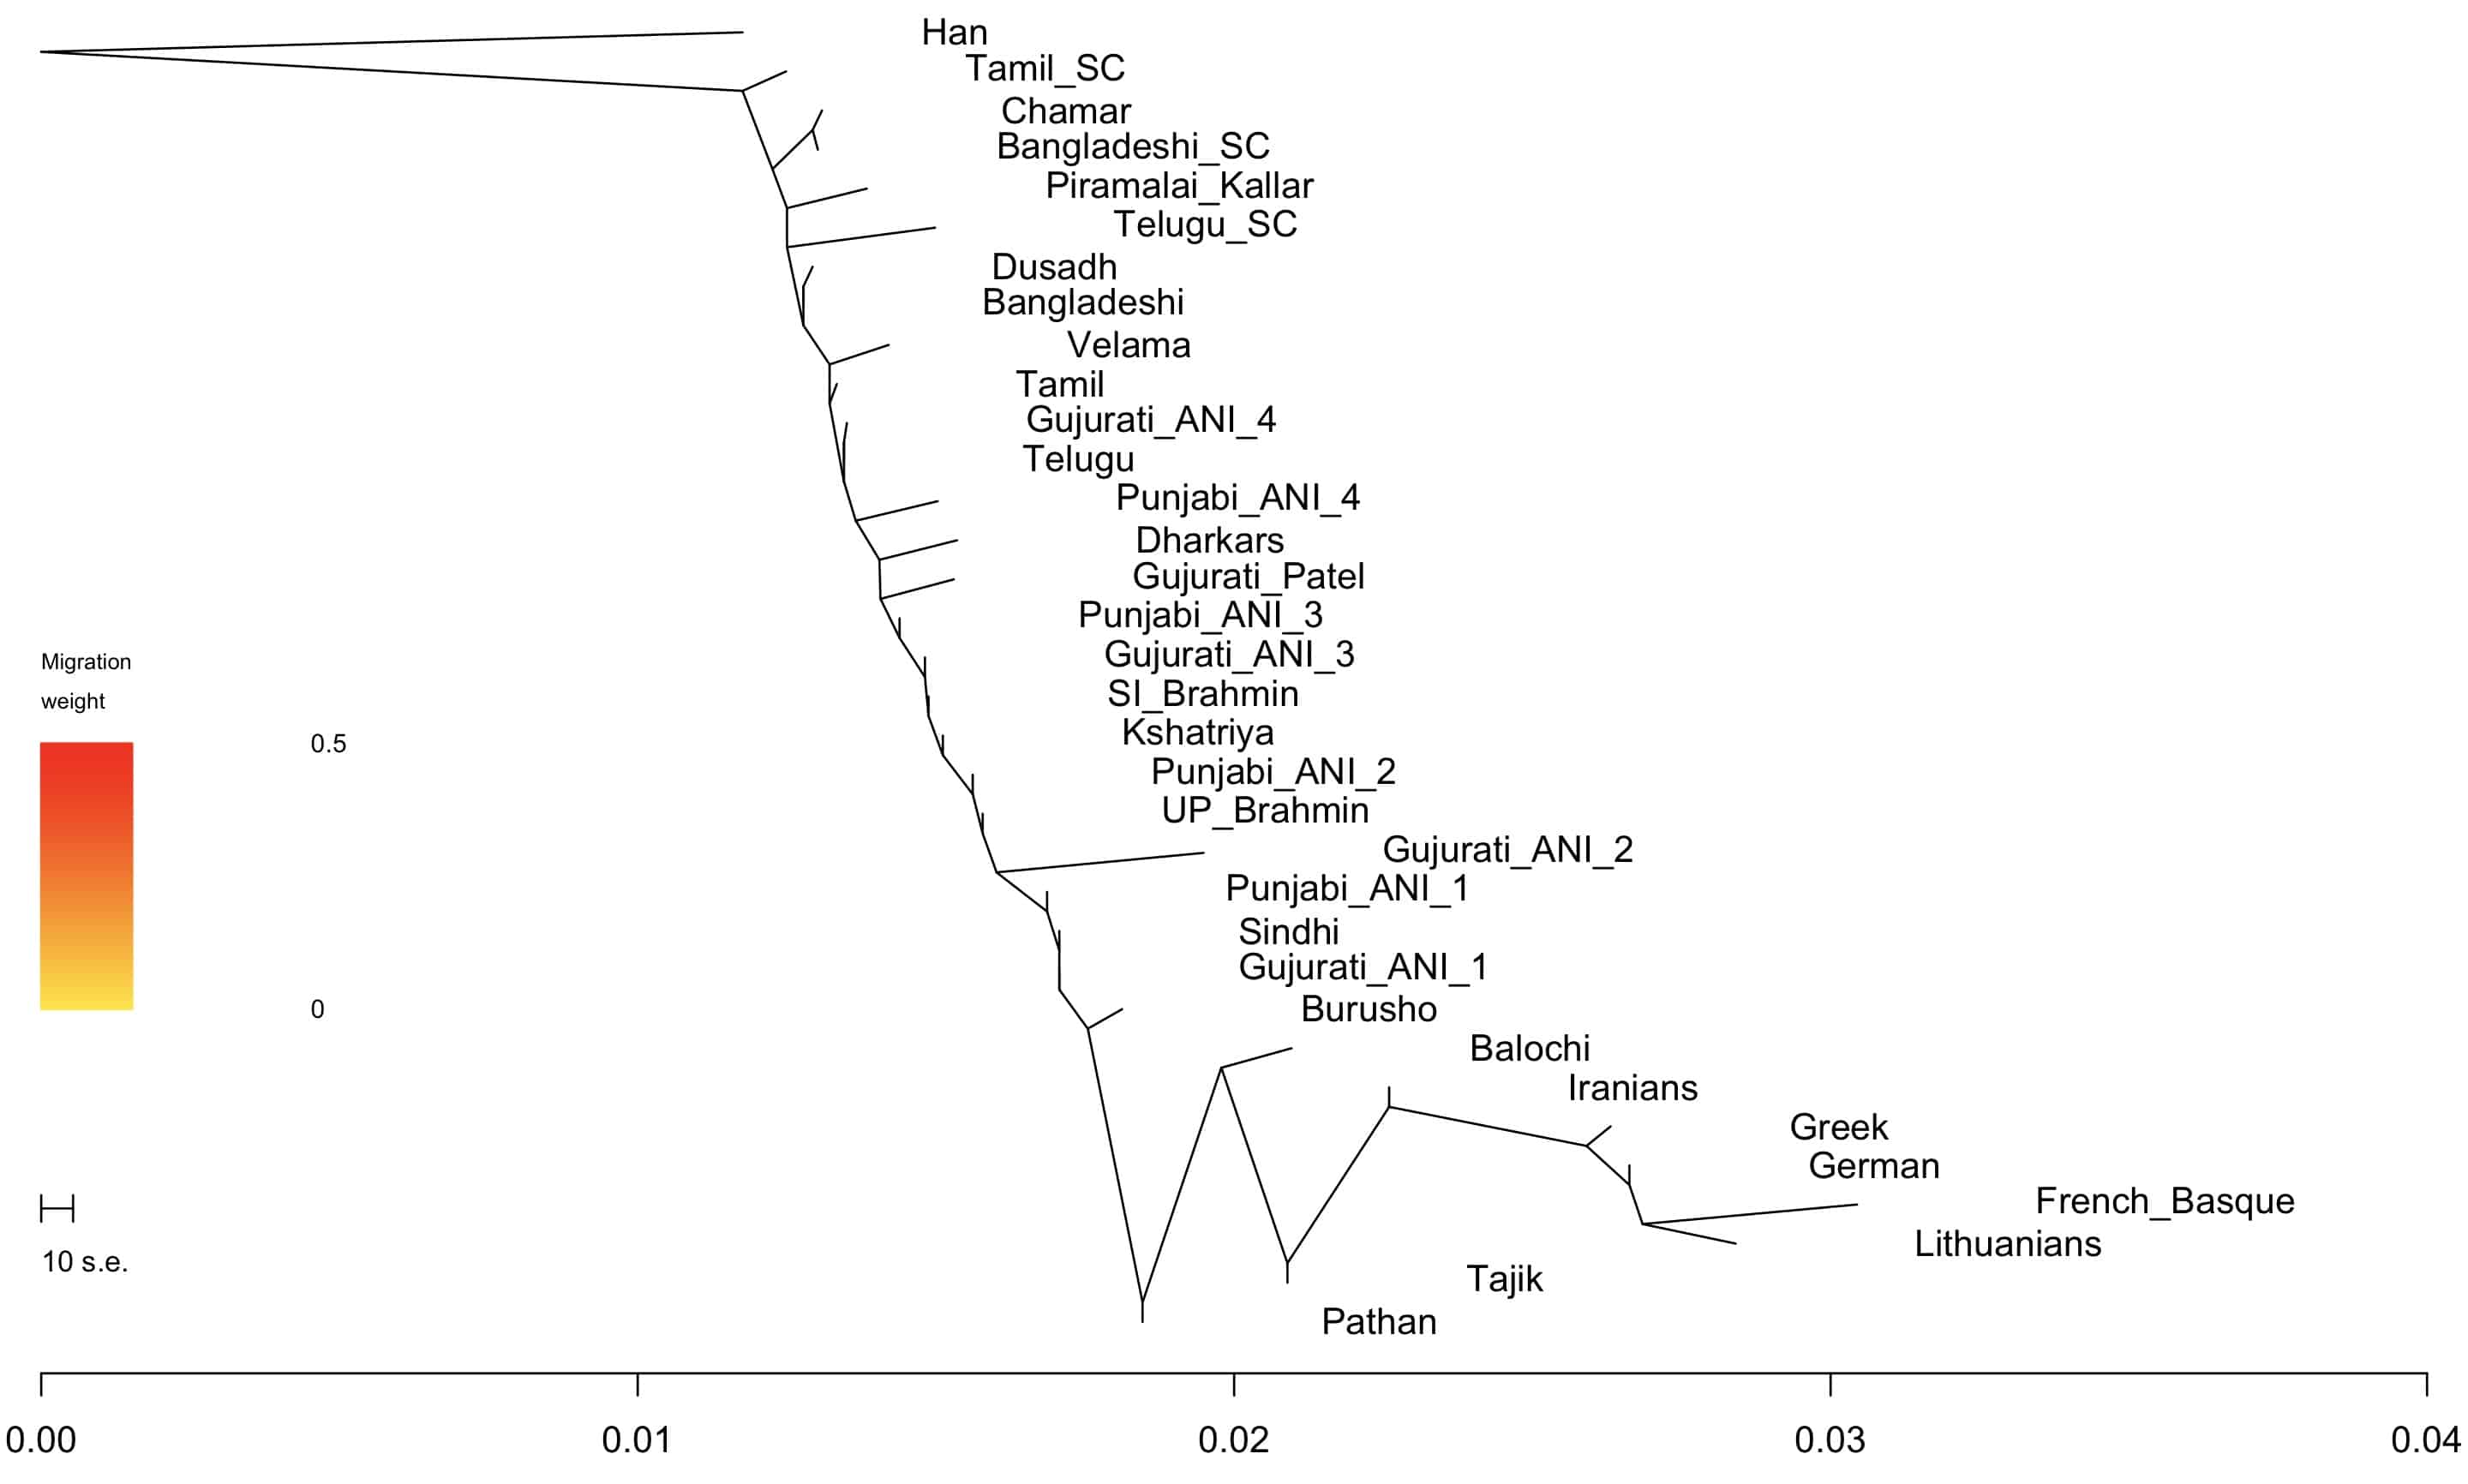
I also generated a PCA plot and a Treemix plot, for the sake of comparison.
It’s also useful to look at a few group comparisons and judge them in a global context.
| Fst | ||
| Tamil | Telugu | 0.0011 |
| Tamil | Tamil Scheduled Caste | 0.0016 |
| Tamil | Bangladeshi | 0.0024 |
| Tamil | South Indian Brahmin | 0.0031 |
| Tamil | Uttar Pradesh Brahmin | 0.0041 |
| Tamil | Sindhi | 0.0087 |
| Tamil | Vietnamese | 0.0668 |
| Southern Chinese | Northern Chinese | 0.0033 |
| Southern Chinese | Vietnamese | 0.0034 |
| Southern Chinese | Korea | 0.0045 |
| Southern Chinese | Japanese | 0.0087 |
| Southern Chinese | Tamil | 0.0711 |
| Southern Chinese | Polish | 0.1141 |
| Gujurati_Patel | Telugu | 0.0062 |
| Gujurati_Patel | Uttar Pradesh Brahmin | 0.0065 |
| Gujurati_Patel | Bangladeshi | 0.0069 |
| Gujurati_Patel | Velama | 0.0094 |
| Gujurati_Patel | Sindhi | 0.0104 |
| Gujurati_Patel | Polish | 0.0405 |
| Gujurati_Patel | Japanese | 0.0781 |
| GreatBritain | Ireland | 0.0015 |
| GreatBritain | Polish | 0.0043 |
| GreatBritain | Sicily | 0.0077 |
| GreatBritain | Uttar Pradesh Brahmin | 0.0264 |
| GreatBritain | Tamil | 0.0430 |
| GreatBritain | Korea | 0.1130 |
The non-Brahmin and non-Dalit samples in the 1000 Genomes are not much partitioned much by geography. The Tamil vs. Telugu difference is smaller than that between the British and Irish. Within Tamil Nadu Brahmins though are nearly as different from typical Tamils as Poles are from the English (most of the British sample is English). The biggest differences in Europe are between Sicilians and Northern European groups, which similar in a degree to that between South Indians and Pakistanis. The South Chinese sample is nearly as close to Vietnamese as it is to a North Chinese group, while the difference between Koreans and Chinese is relatively small when compared to the variance you see in South Asia and Europe.
Note: Drift tends to inflate Fst.